A forensic audit of the $35.9B non-traded BDC managed by Blue Owl Credit Advisers — updated through Q4 2025 using SEC EDGAR 10-Q (Sep 30, 2025) and 10-K (Dec 31, 2025). Fourteen red flags identified. Rating 3 (stressed) loans grew +324% from Q1 2024 to Q4 2025 ($425M → $1.80B); Rating 4 (Materially Below) emerged from $0 to $103M in 2025; distribution coverage fell below 1.0x for the first time (FY 2025 NII $0.80/share vs. distributions $0.877/share = 0.91×); and the valuation gap between stated NAV ($9.32) and OBDC market-implied value (~$7.13) persists at ~$2.19/share (23.5%).
Vol. 6 — Forensic Audit Dashboard
| Metric | Q4 2024 | Q4 2025 |
|---|---|---|
| Total Investments at Fair Value | $26.4B | $35.9B (+36%) |
| Total Net Assets (Equity) | $14.5B | $19.8B |
| Total Debt Outstanding | $12.7B | ~$15.0B |
| Net Debt-to-Equity Ratio | 0.87× | 0.76× (stated) |
| WA Portfolio Yield (FV) | 9.9% | 8.9% (−100bps more) |
| New Commitment Yield | 9.1% | 8.4% (FY 2025 avg) |
| Annual NII per Share (Class I) | $1.02 | $0.80 (−21.6%) |
| Portfolio Companies | 339 | 370 |
| Stress Signal | Q4 2024 | Q4 2025 |
|---|---|---|
| Rating 3 Loans (Below Expectations) | $1.15B — 4.4% of FV | $1.80B — 5.0% of FV (+57% YoY) |
| Rating 4 Loans (Materially Below) | $0 — did not exist | $103M — NEW category emerged in 2025 |
| Rating 5 Loans (Anticipated Loss) | $31.5M | $24M (slight improvement) |
| Distribution Coverage Ratio | 1.00× (zero buffer) | 0.91× — below 1.0× for first time |
| Annual NII vs. Distributions | $1.02 vs. $0.972 | $0.80 vs. $0.877 — distributions exceed income |
| Interest Expense (Annual) | $956M est. | $973M (+22% vs. FY 2024) |
| Healthcare + Software Concentration | 35.3% | ~36.5% (healthcare providers grew to 13.9%) |
| Valuation Metric | Q4 2024 | Q4 2025 |
|---|---|---|
| OCIC Stated NAV/Share (Class I) | $9.57 | $9.32 (−$0.25 in 2025) |
| OBDC Market-Implied Value | ~$7.22 (24.5% discount) | ~$7.13 (23.5% discount) |
| Implied Overstatement per Share | ~$2.35 (24.5%) | ~$2.19 (23.5%) |
| OBDC Price / NAV (March 2026) | — | $11.18 / $14.62 = 0.765× |
| Portfolio Overlap (OCIC / OBDC) | — | 8 of OCIC top 10 borrowers in OBDC portfolio |
| Level 3 Assets (Est.) | ~100% | ~100% — all marks are internal estimates |
| Up to 100% of Distributions | Adviser-reimbursed | Per prospectus — not guaranteed income |
Sources: OCIC Q4 2024 Earnings Presentation · SEC EDGAR 10-Q (Sep 30, 2025) & 10-K (Dec 31, 2025) · CIK 0001812554 · OBDC NYSE pricing (March 24, 2026) · PCI independent analysis
Vol. 6 — Forensic Audit: Blue Owl Credit Income Corp
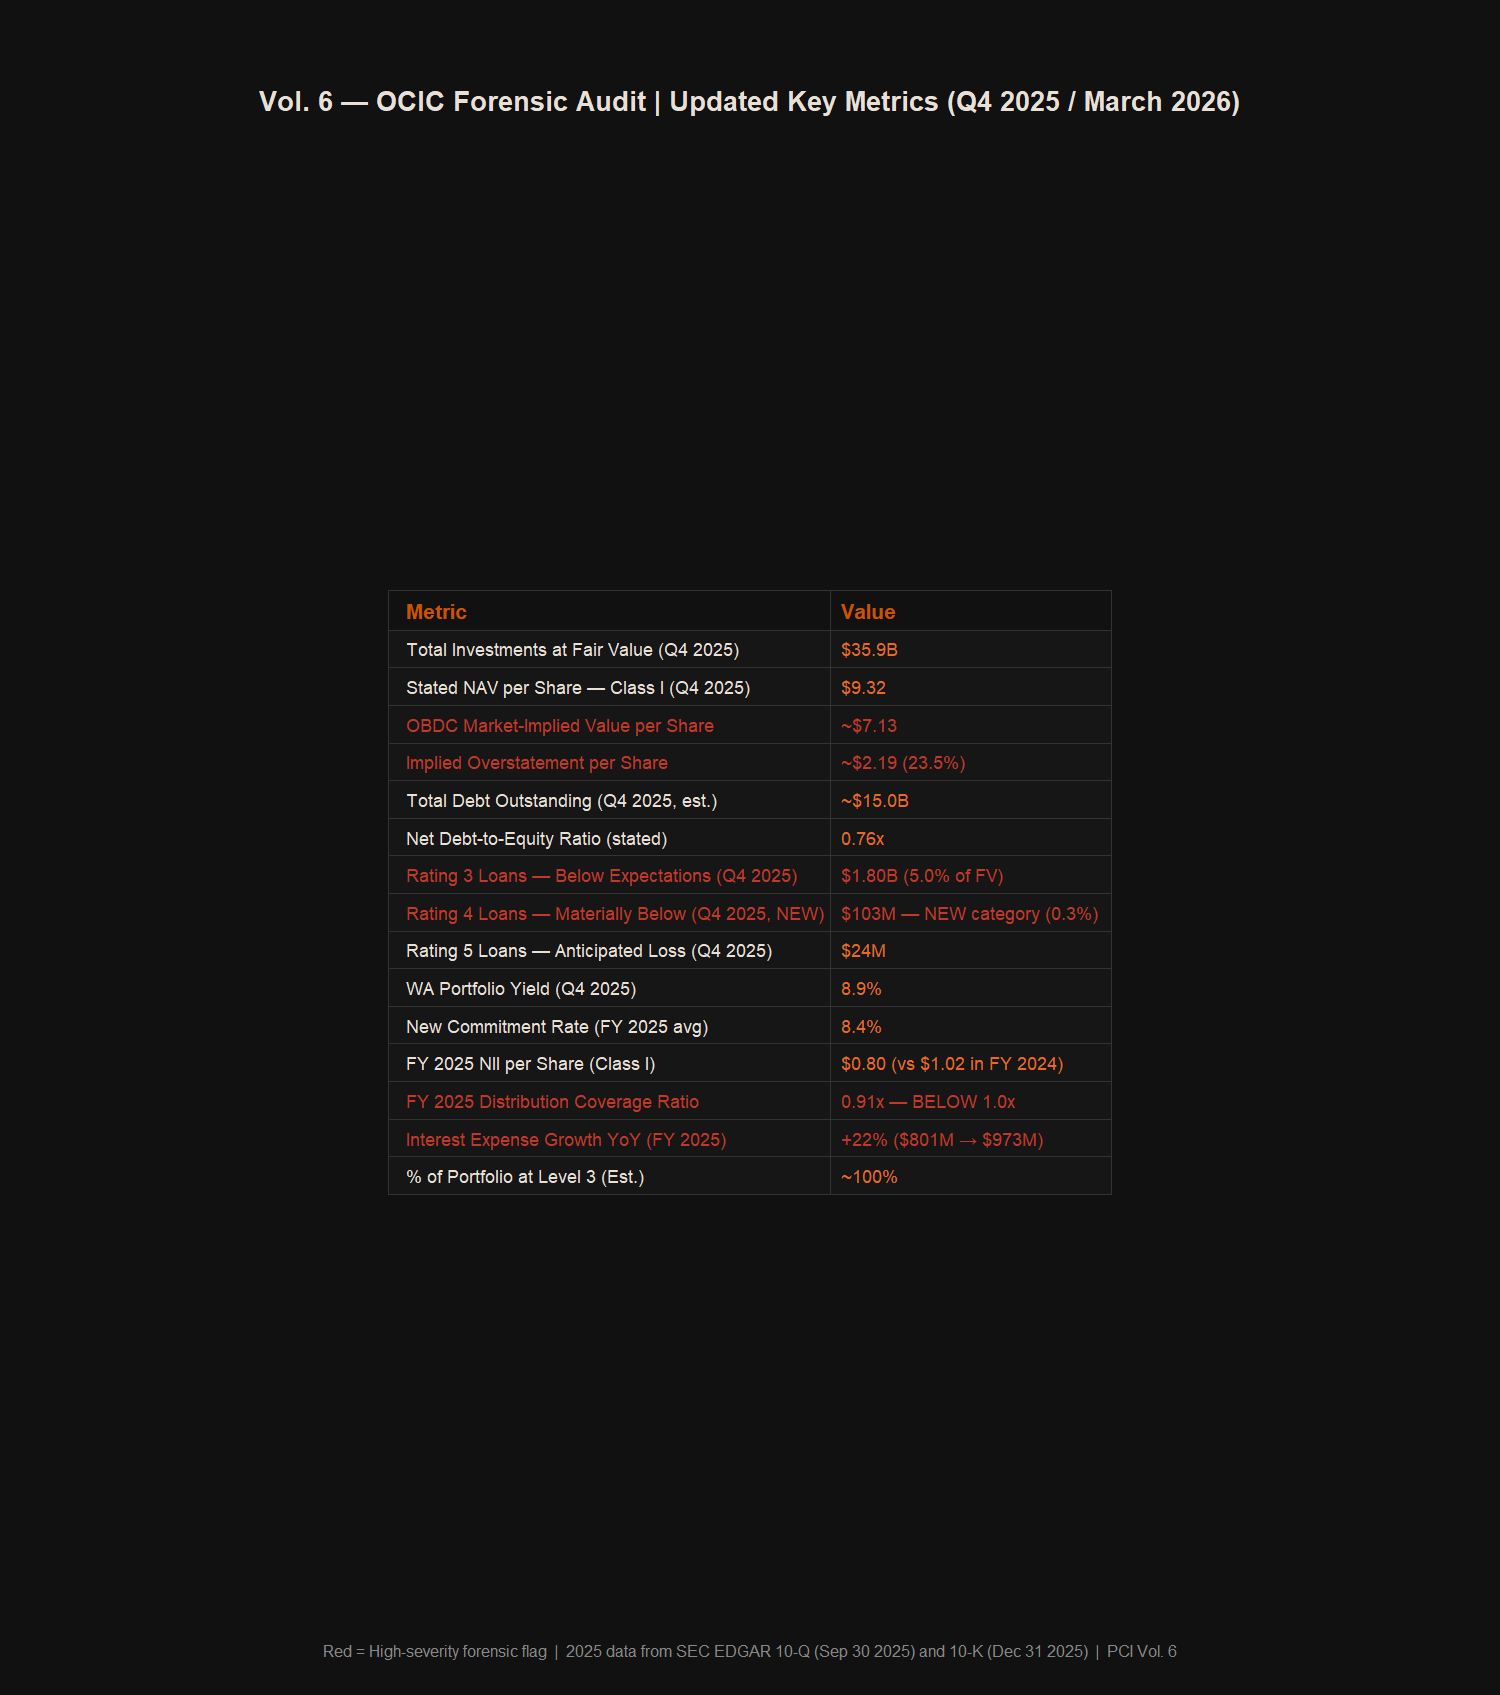
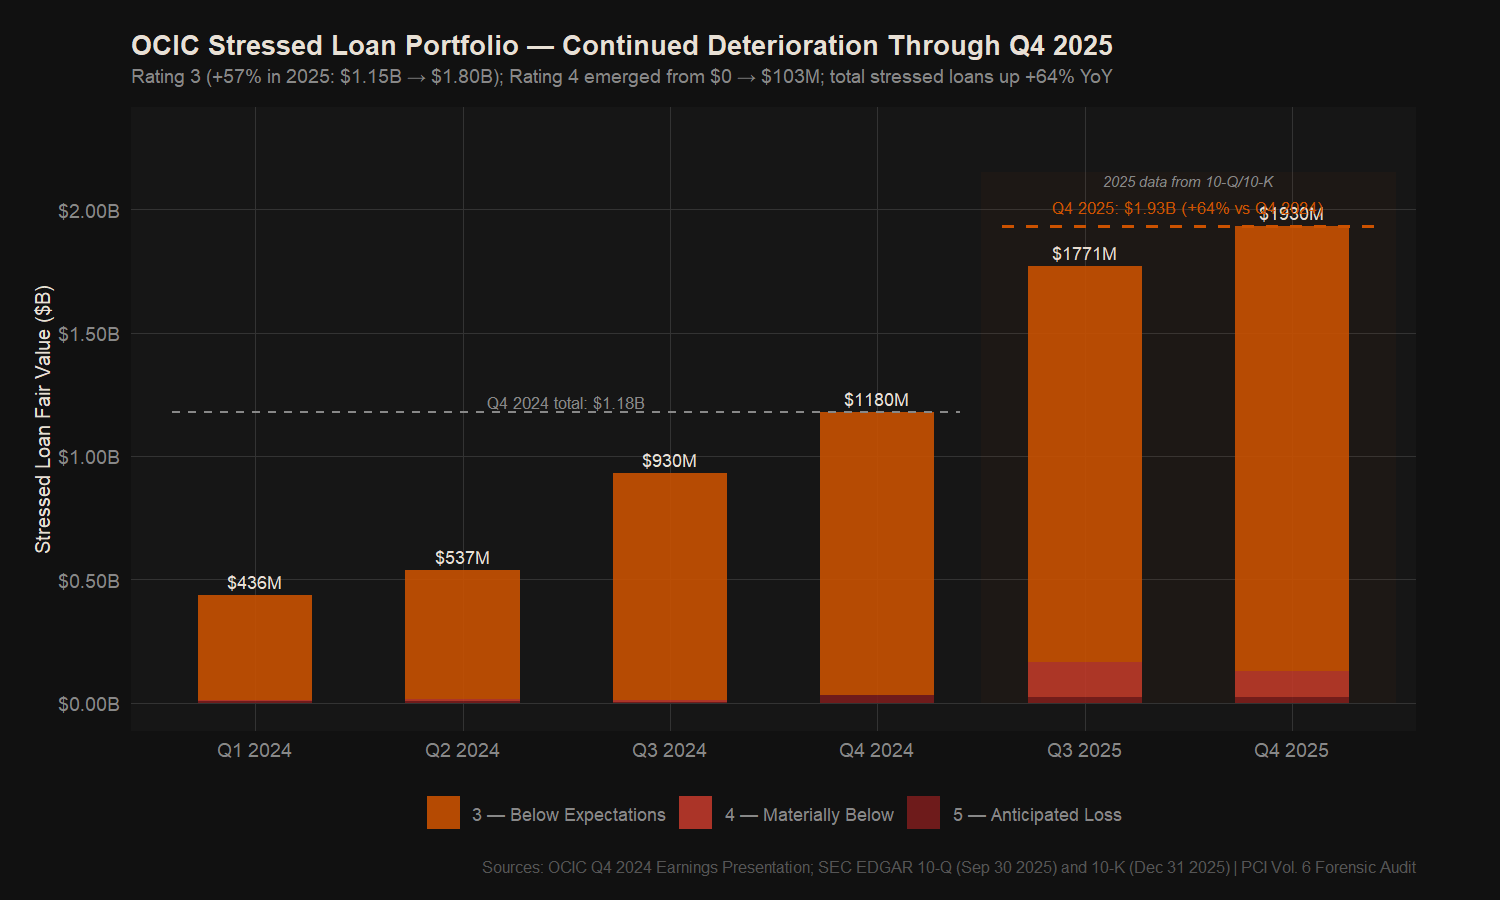
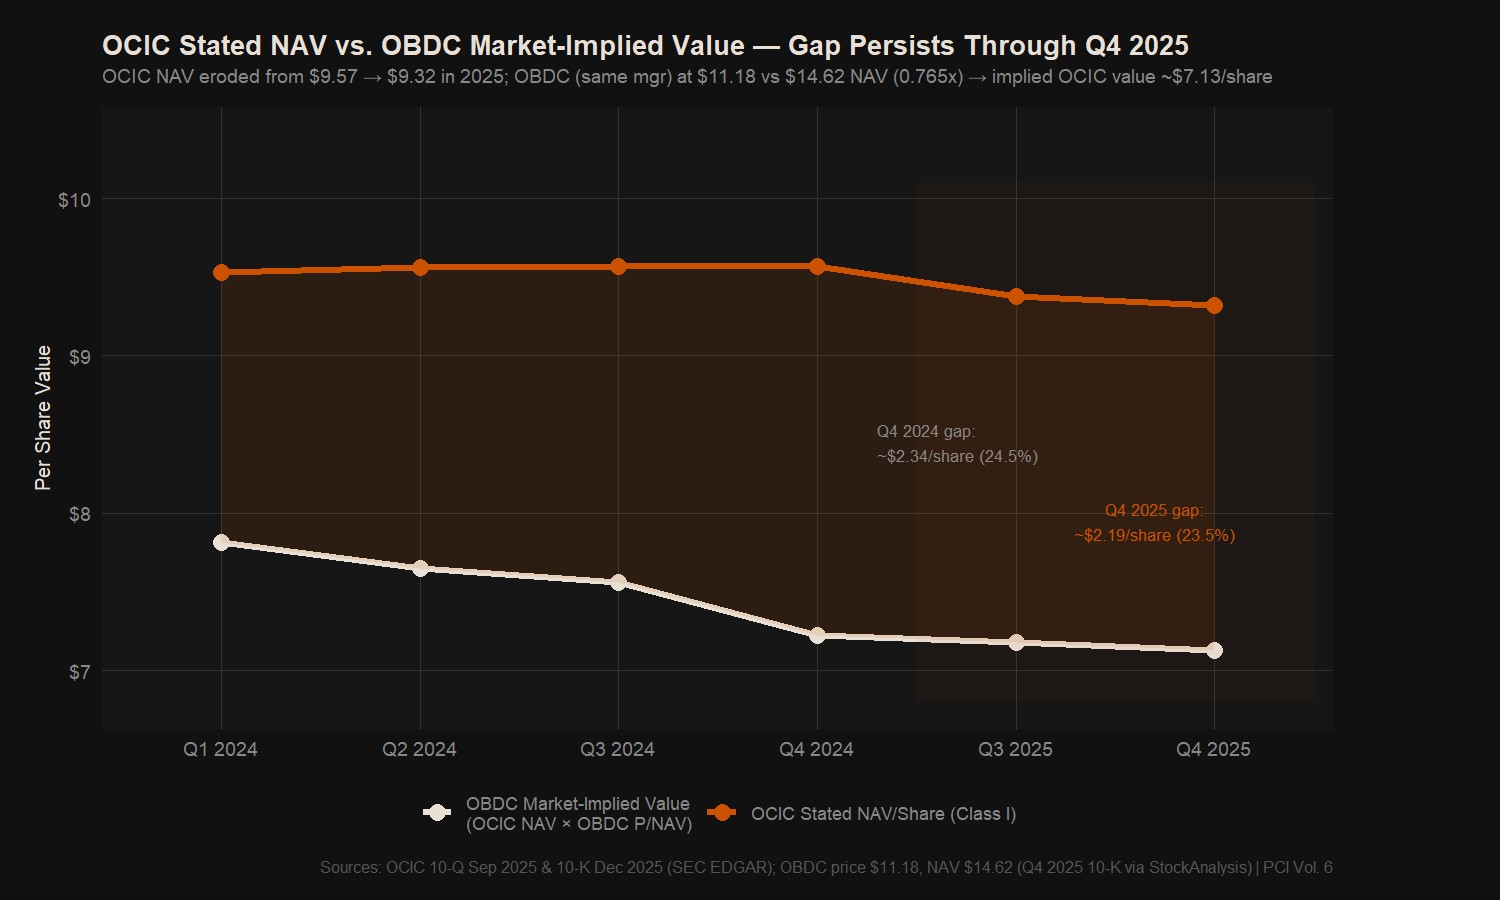
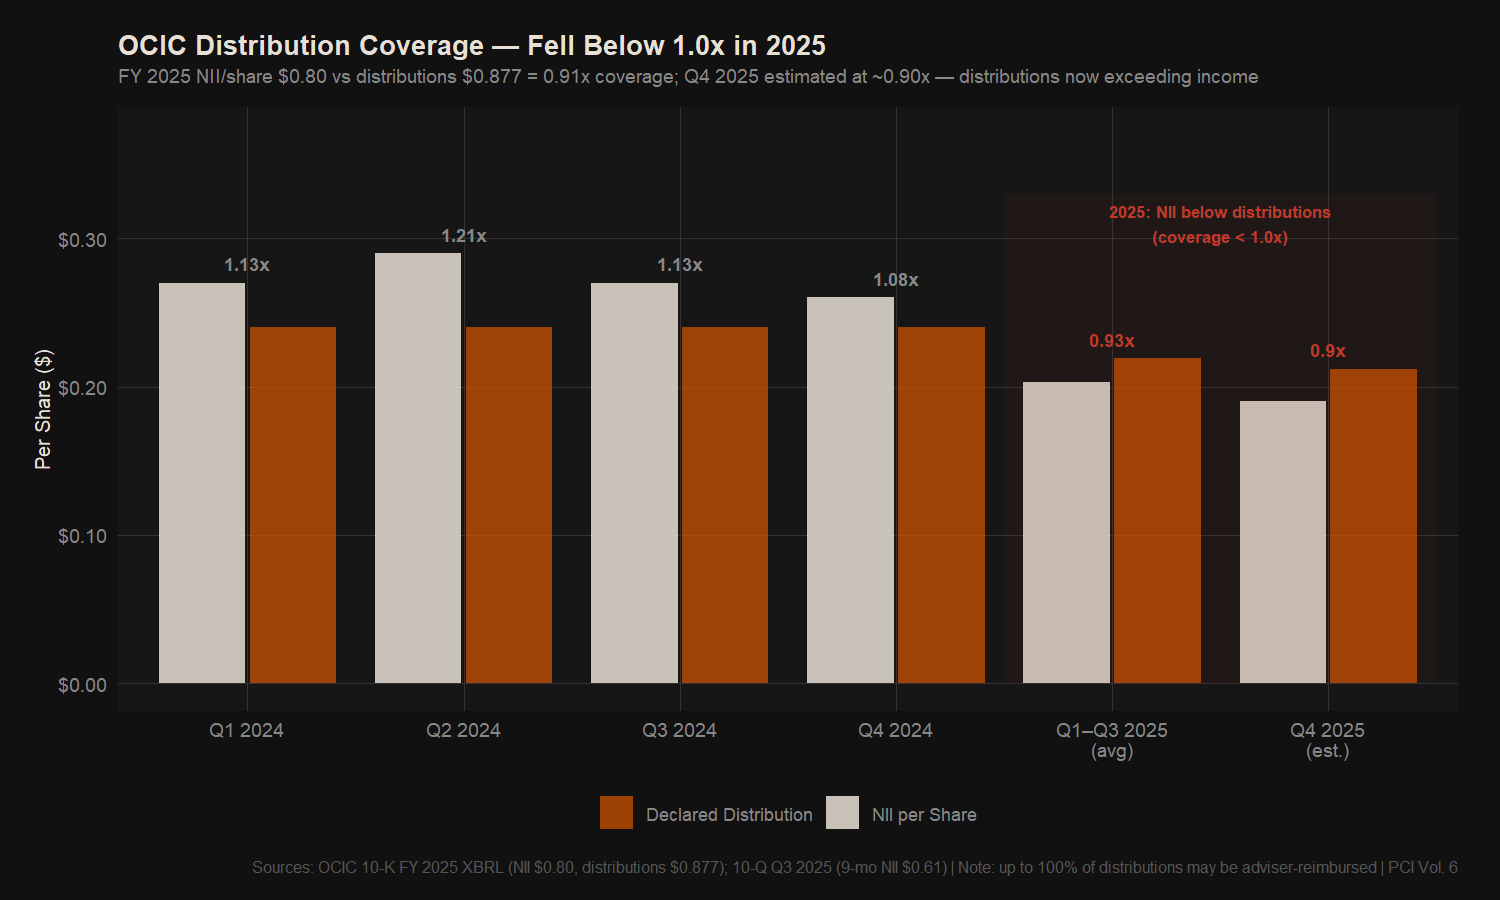
OCIC's headline NAV has been managed to near-flatness — $9.53 to $9.57 across all of 2024, then $9.32 by Q4 2025. But the internal portfolio rating data tells a different story. Rating 3 (Below Expectations) loans have grown +324% from Q1 2024 to Q4 2025 ($425M → $1.80B). Rating 4 (Materially Below) — a category that did not exist in Q4 2024 — emerged at $103M by year-end 2025. FY 2025 NII per share fell to $0.80 versus distributions of $0.877 — distribution coverage fell below 1.0× for the first time. And the publicly traded vehicle run by the same manager — OBDC — continues to trade at a ~23.5% discount to its own stated NAV. Applied to OCIC, that implies a market-clearing value of approximately $7.13 per share against the stated $9.32.
Internal Rating Migration — Updated Through Q4 2025 (+324% Total Stressed Growth)
Distribution Coverage — Fell Below 1.0× in FY 2025
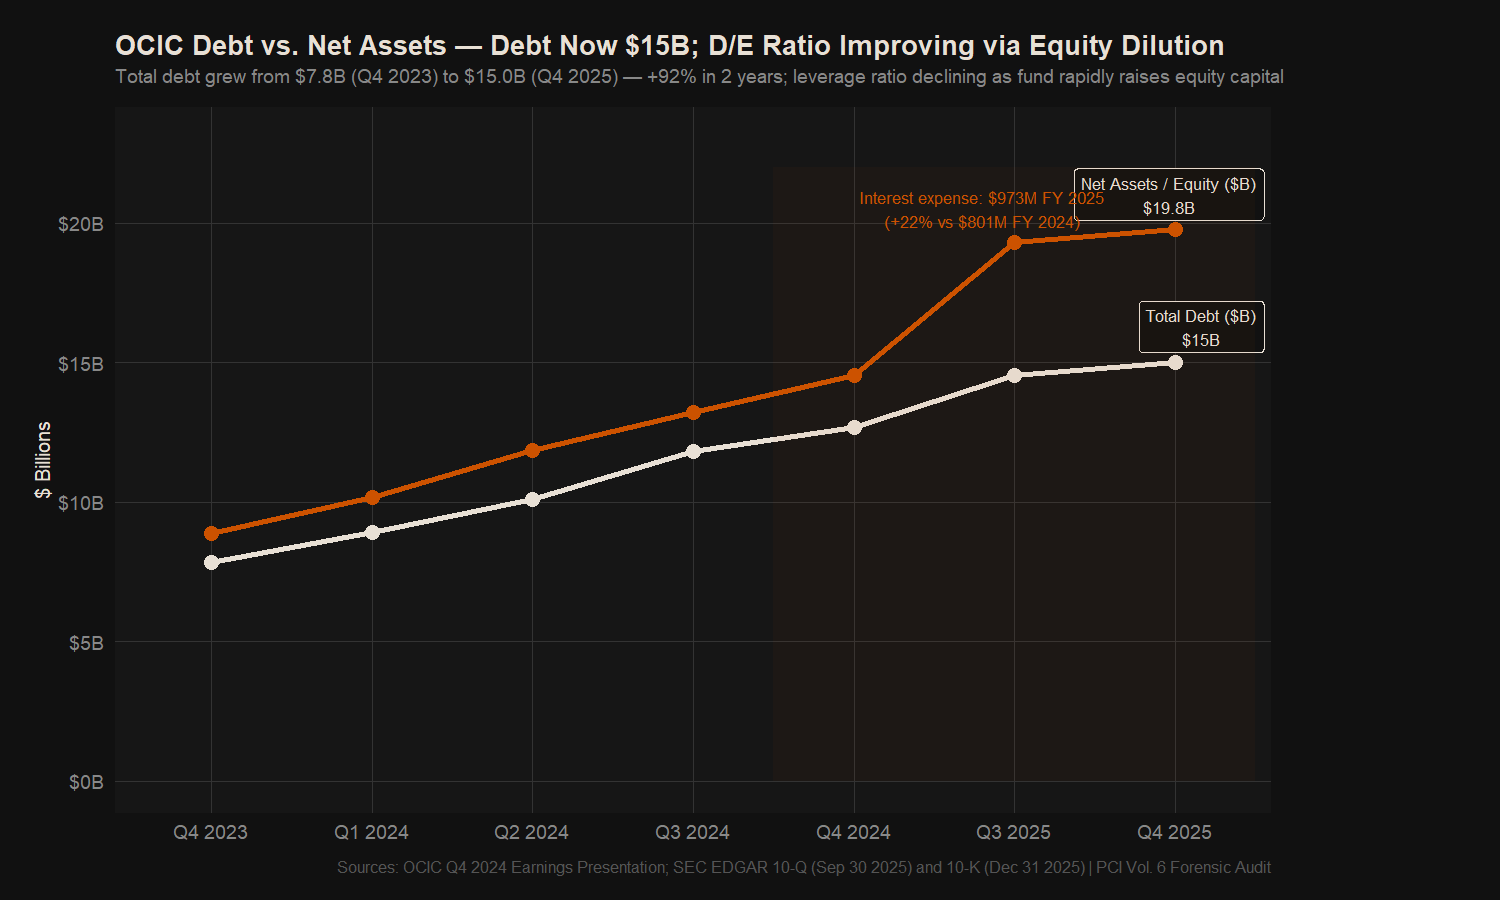
Debt Growth — $7.8B to $15.0B in Two Years; Interest Expense +22% in 2025
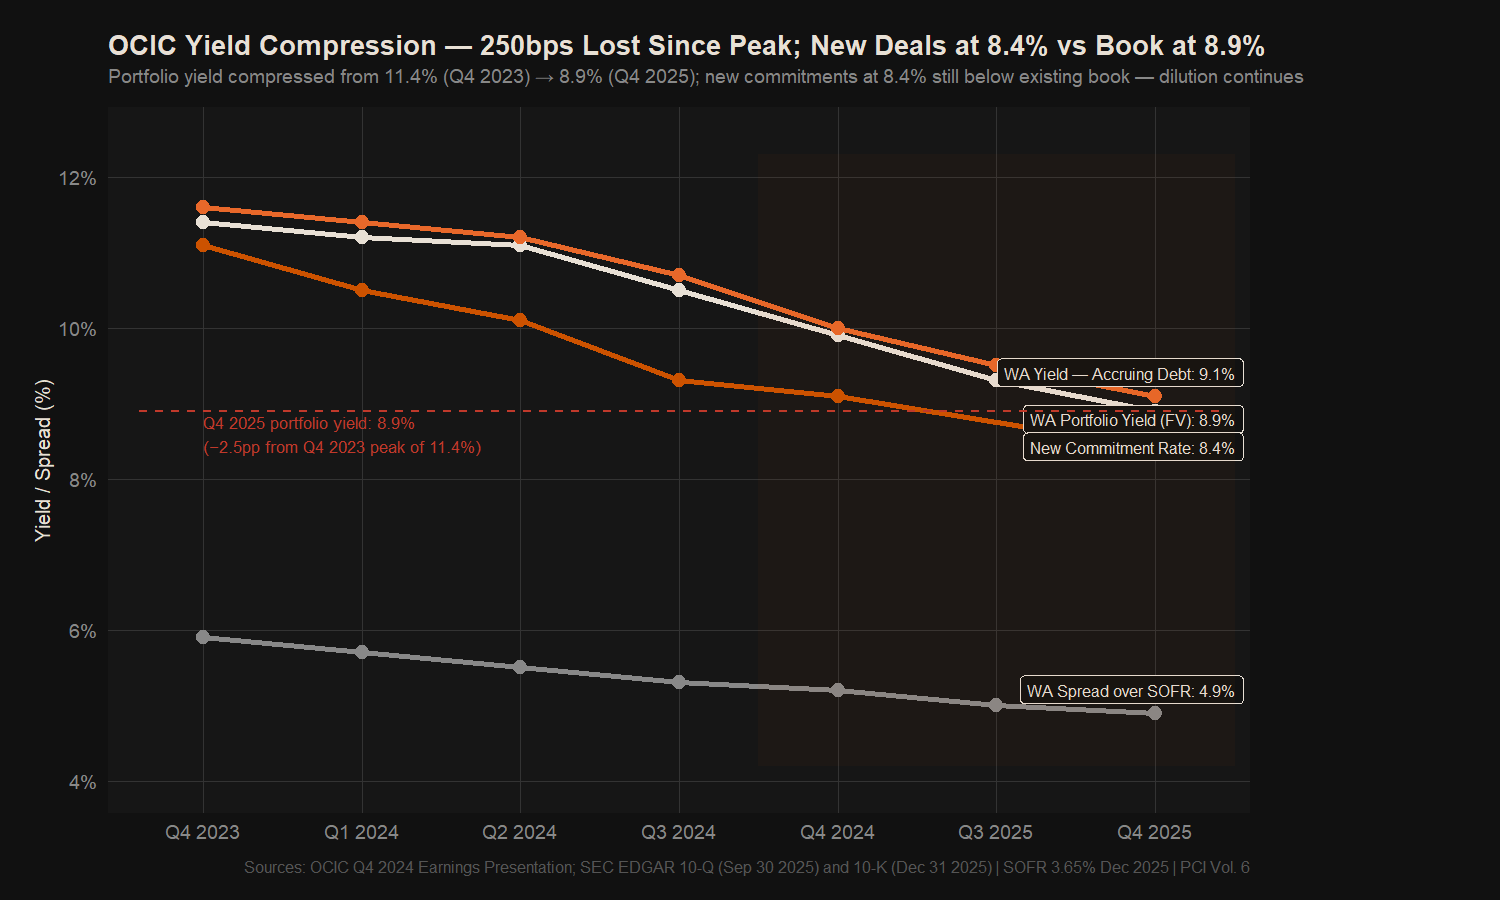
Yield Compression — 250bps Lost Since Peak; New Deals Still Below Book Yield
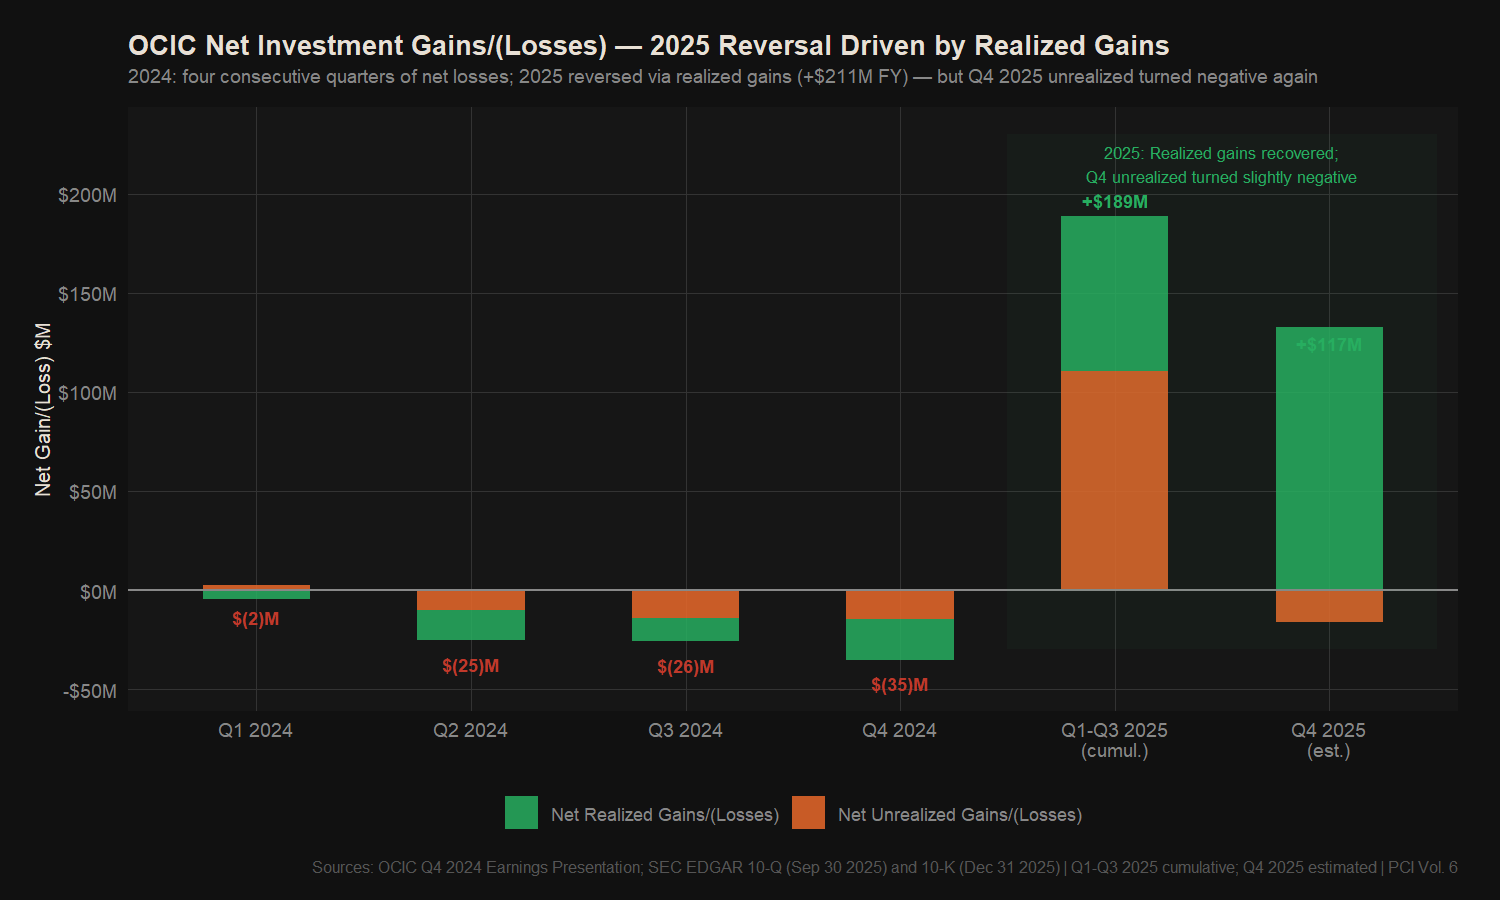
Investment Gains/(Losses) — 2025 Reversal via Realized Gains; Q4 Unrealized Negative Again
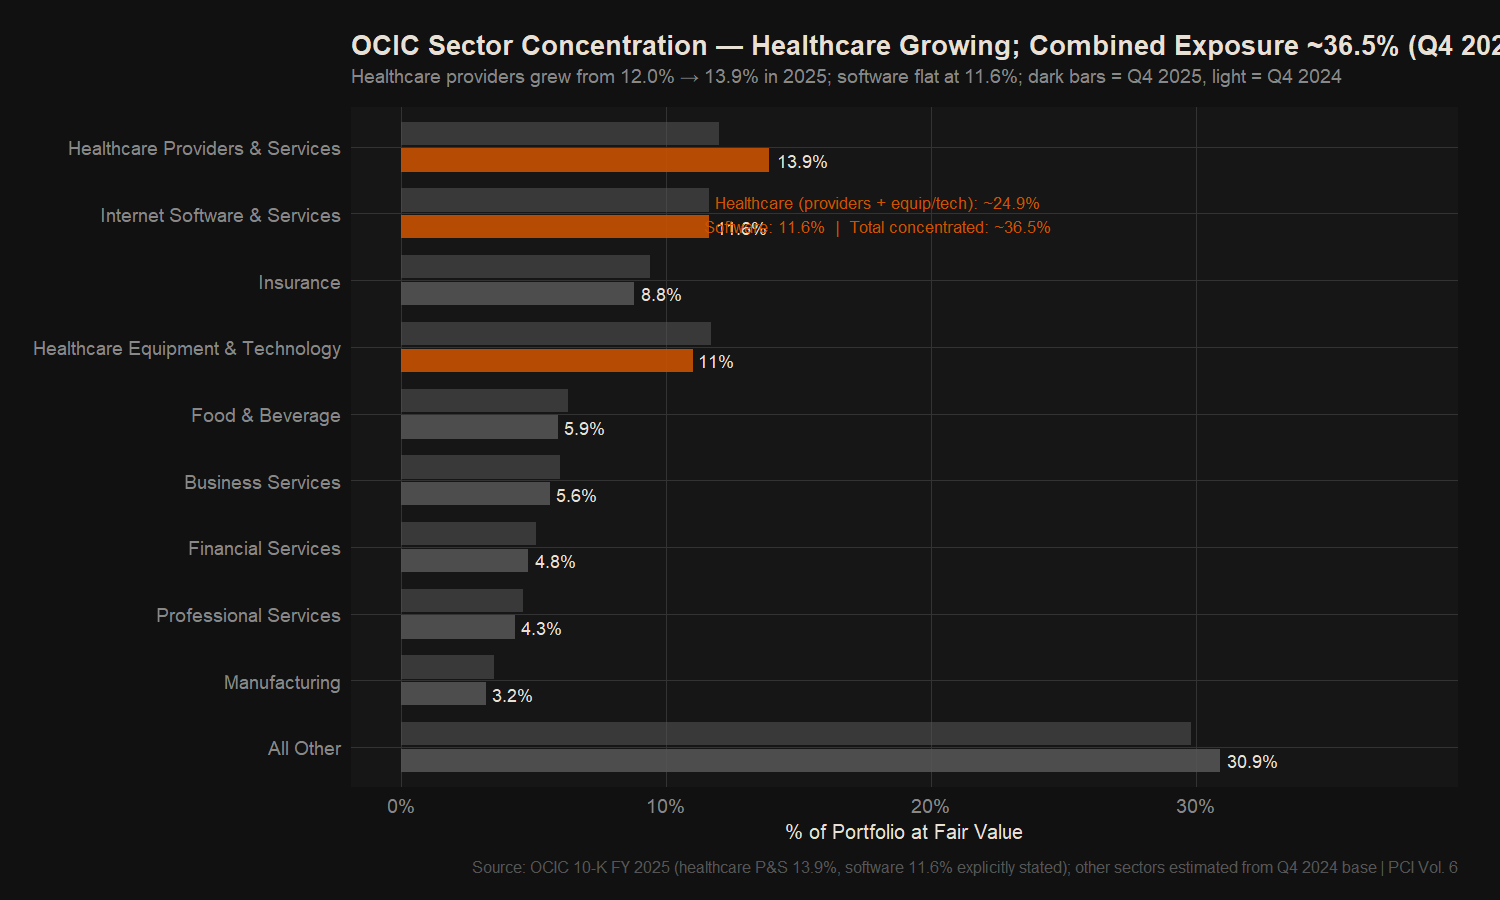
Sector Concentration — Healthcare Growing to 13.9%; Combined ~36.5%
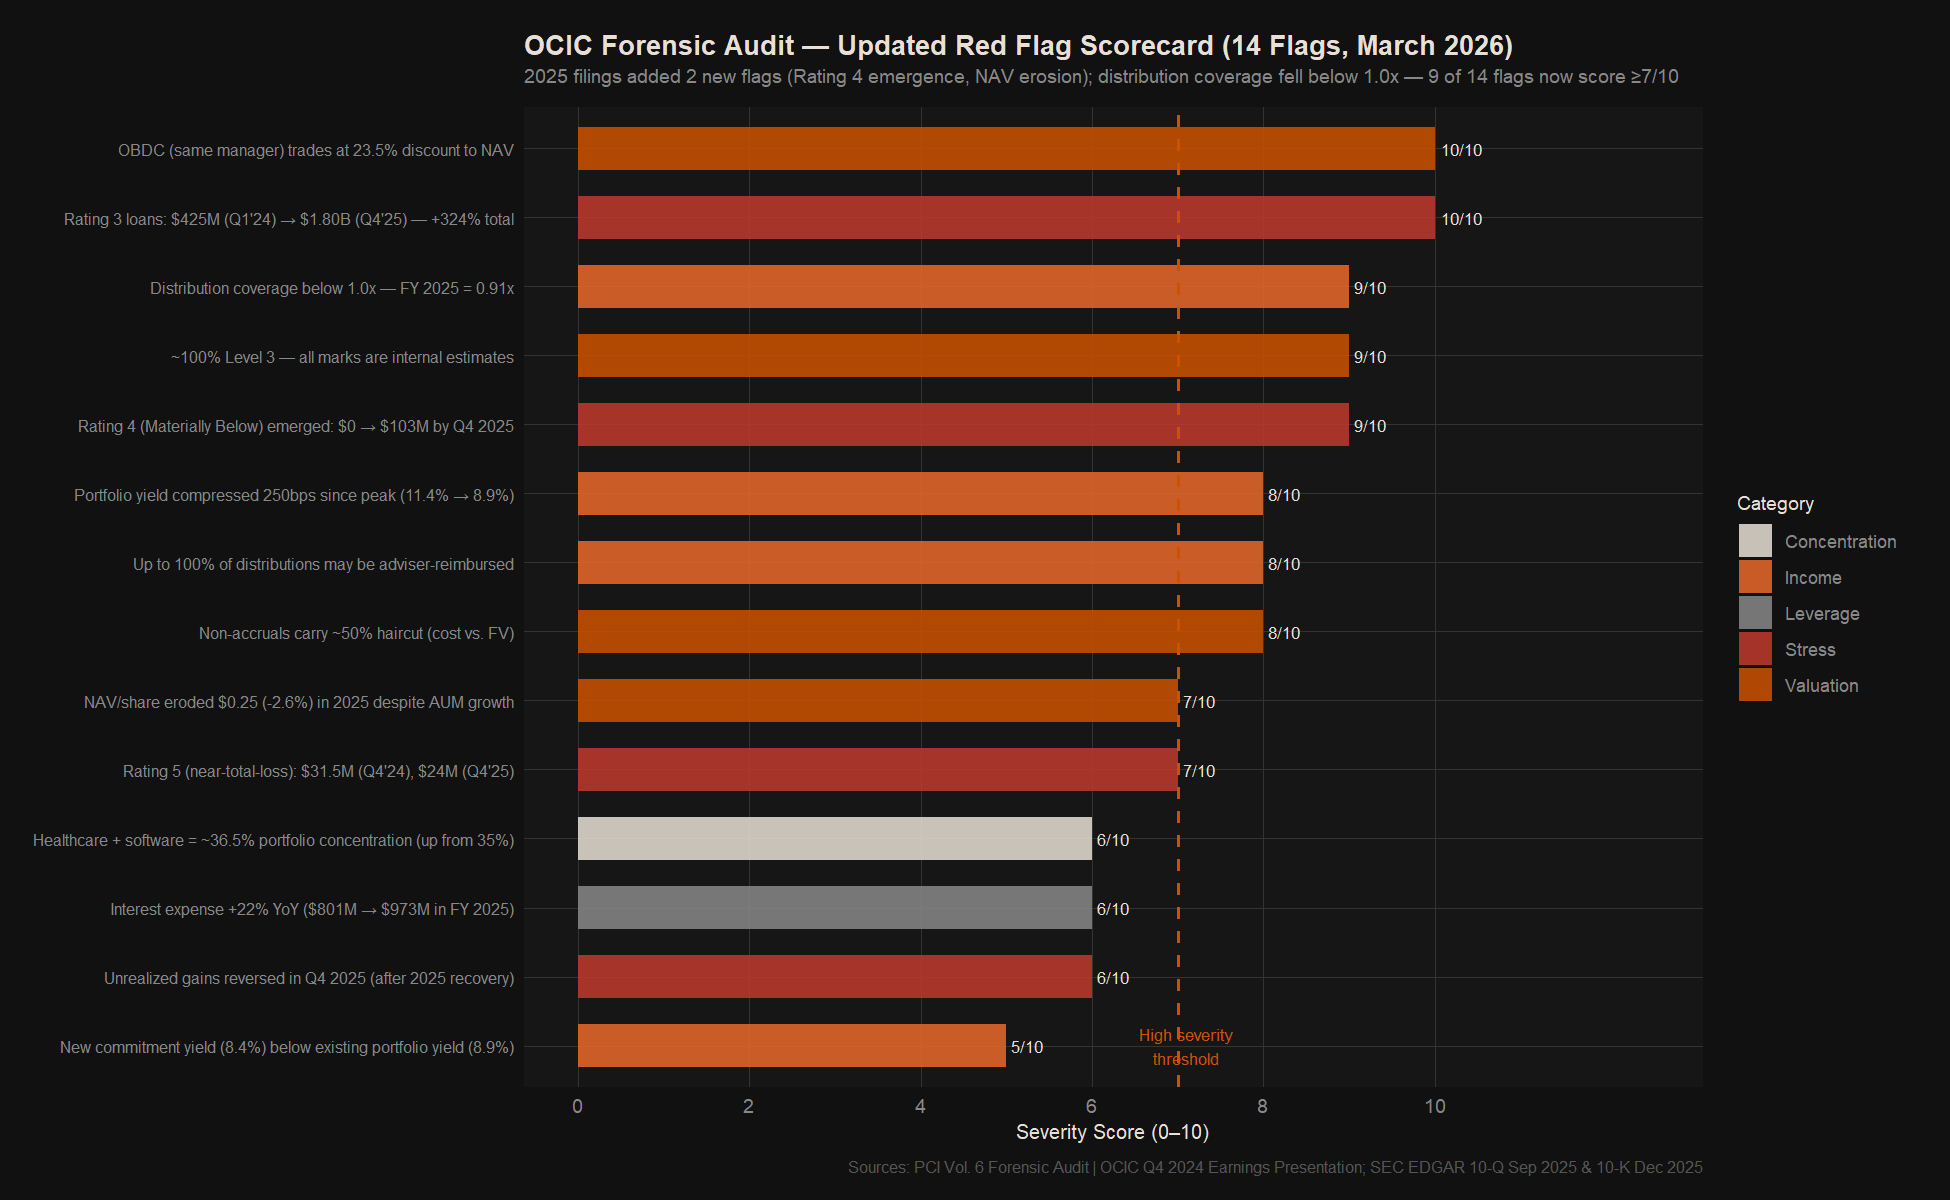
Forensic Red Flag Scorecard — Updated: 14 Flags, 9 Scoring ≥7/10
Forensic Audit Summary Dashboard — Updated Q4 2025