Vol. 1 — Full Static Exports
Index Tables, Heatmaps & Charts
High-resolution PNG exports from the R pipeline. Click any image to open full-screen.
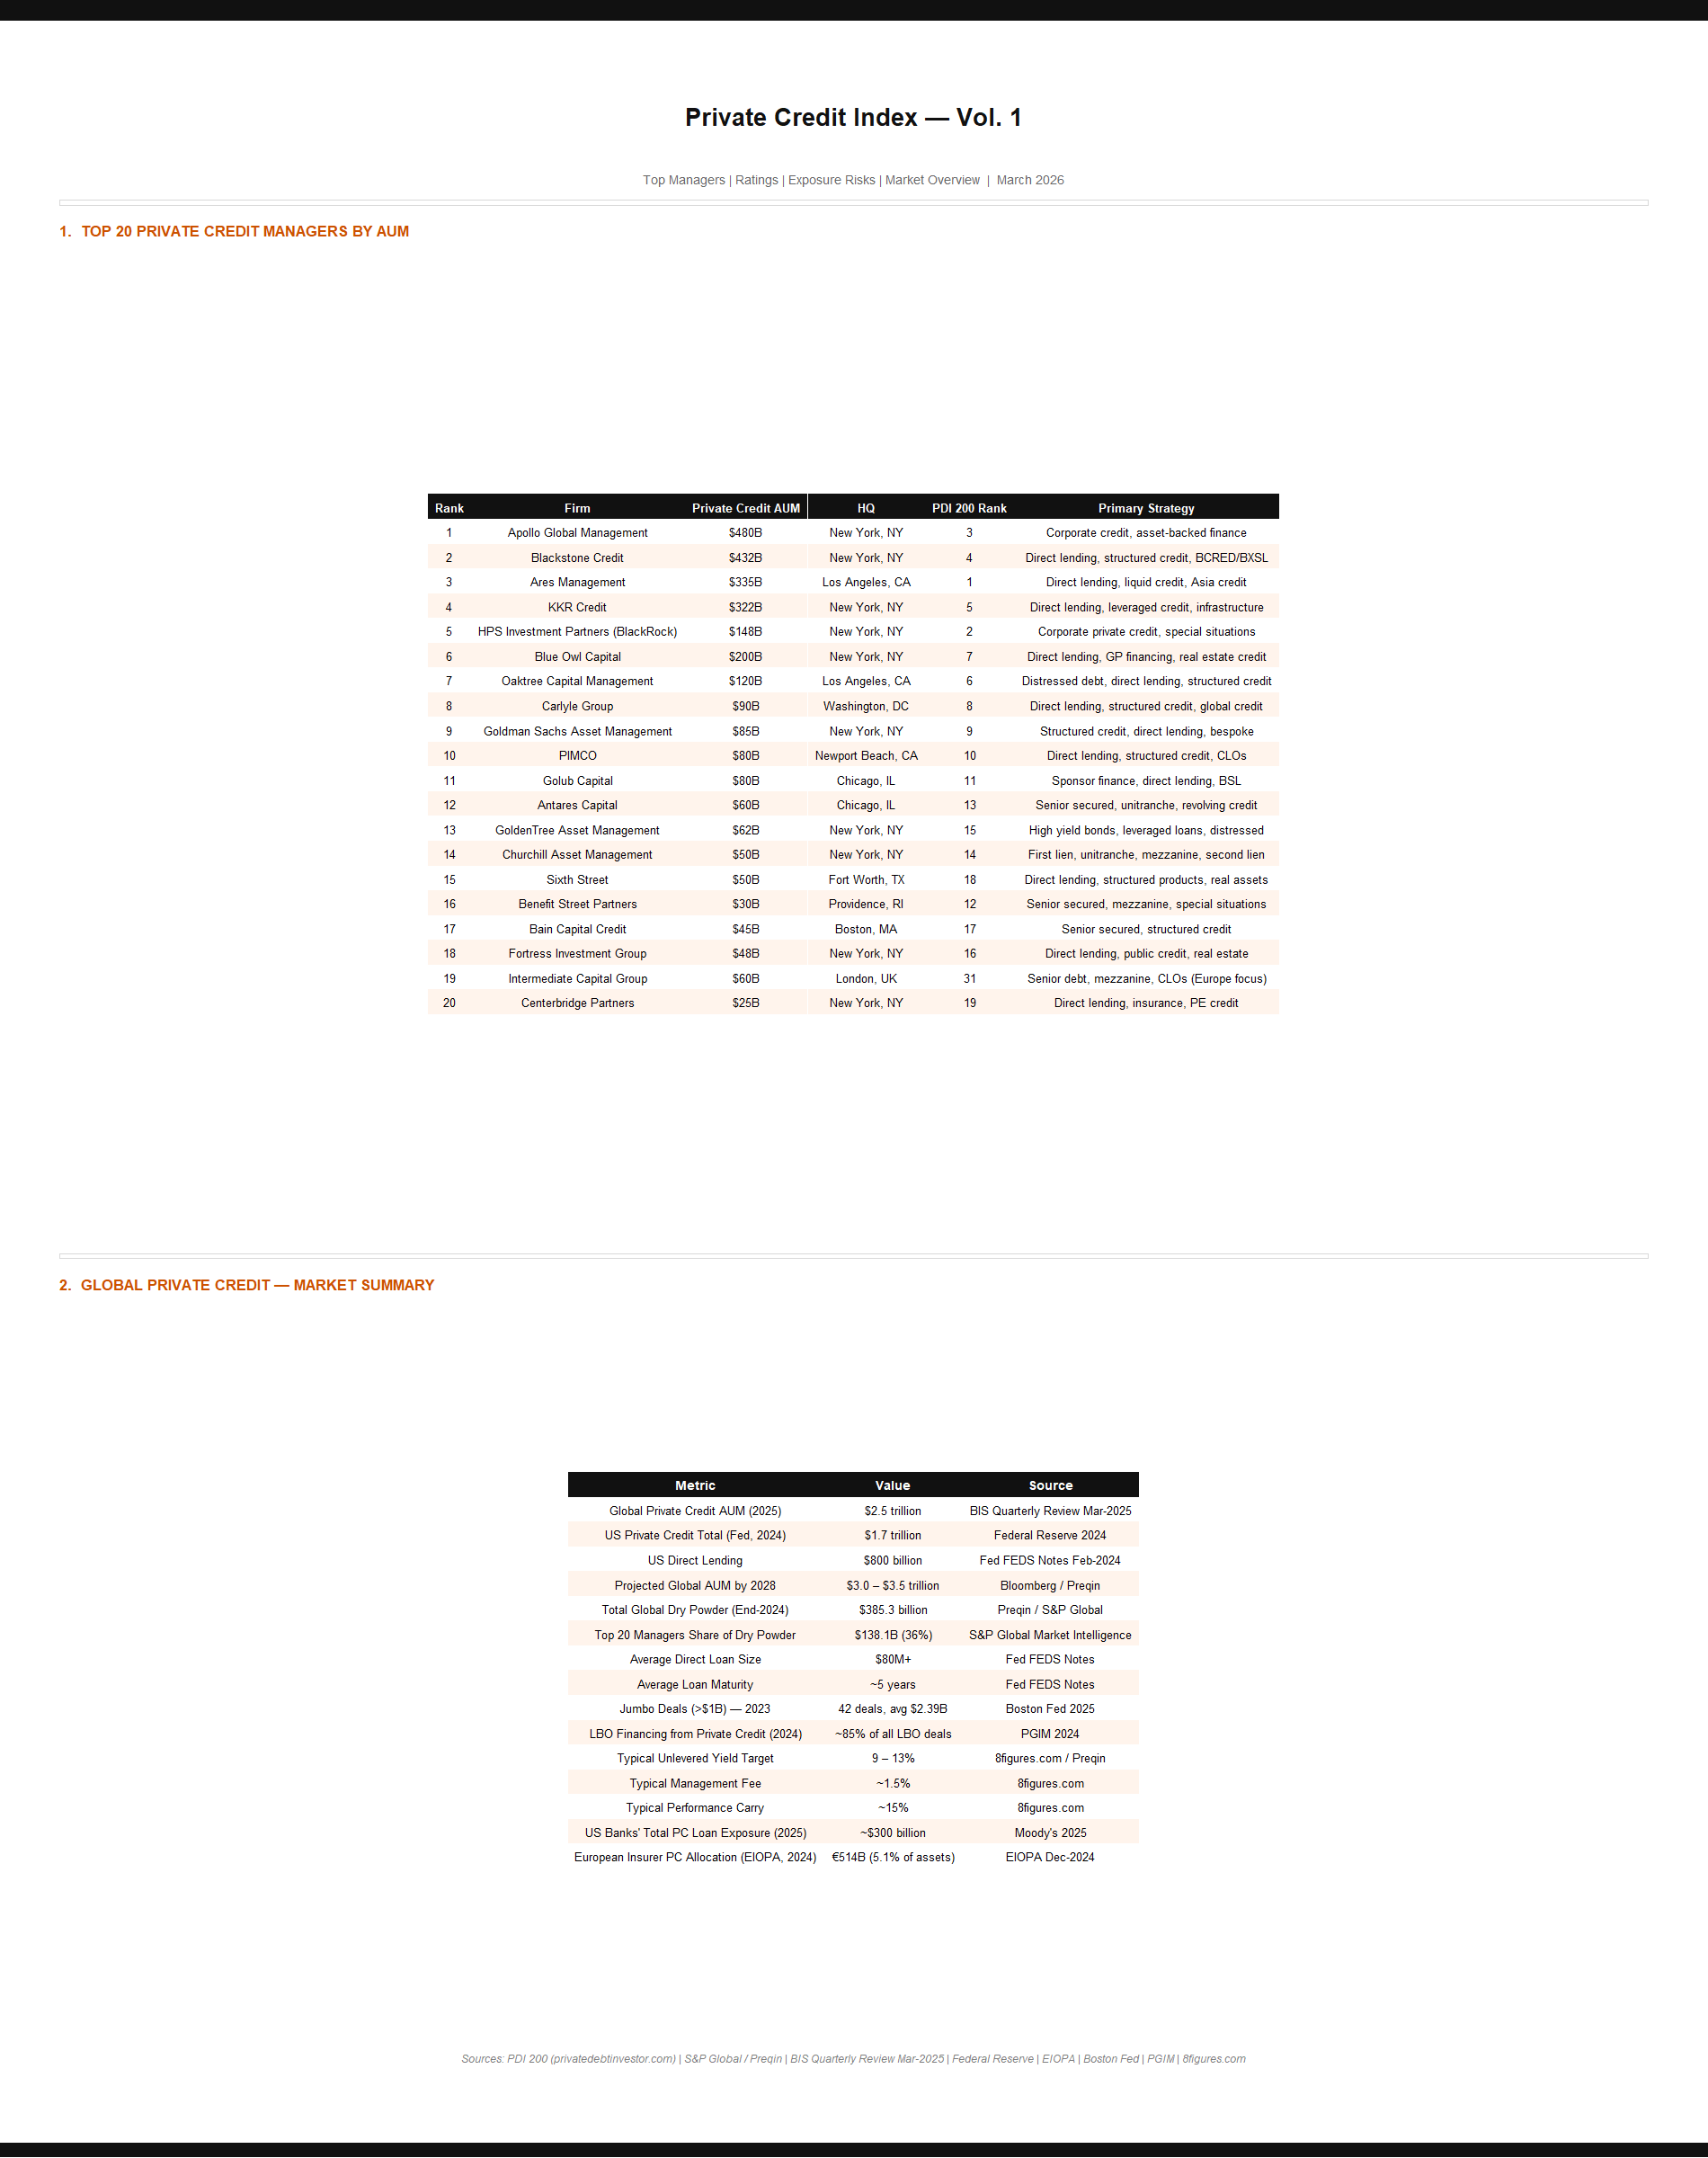
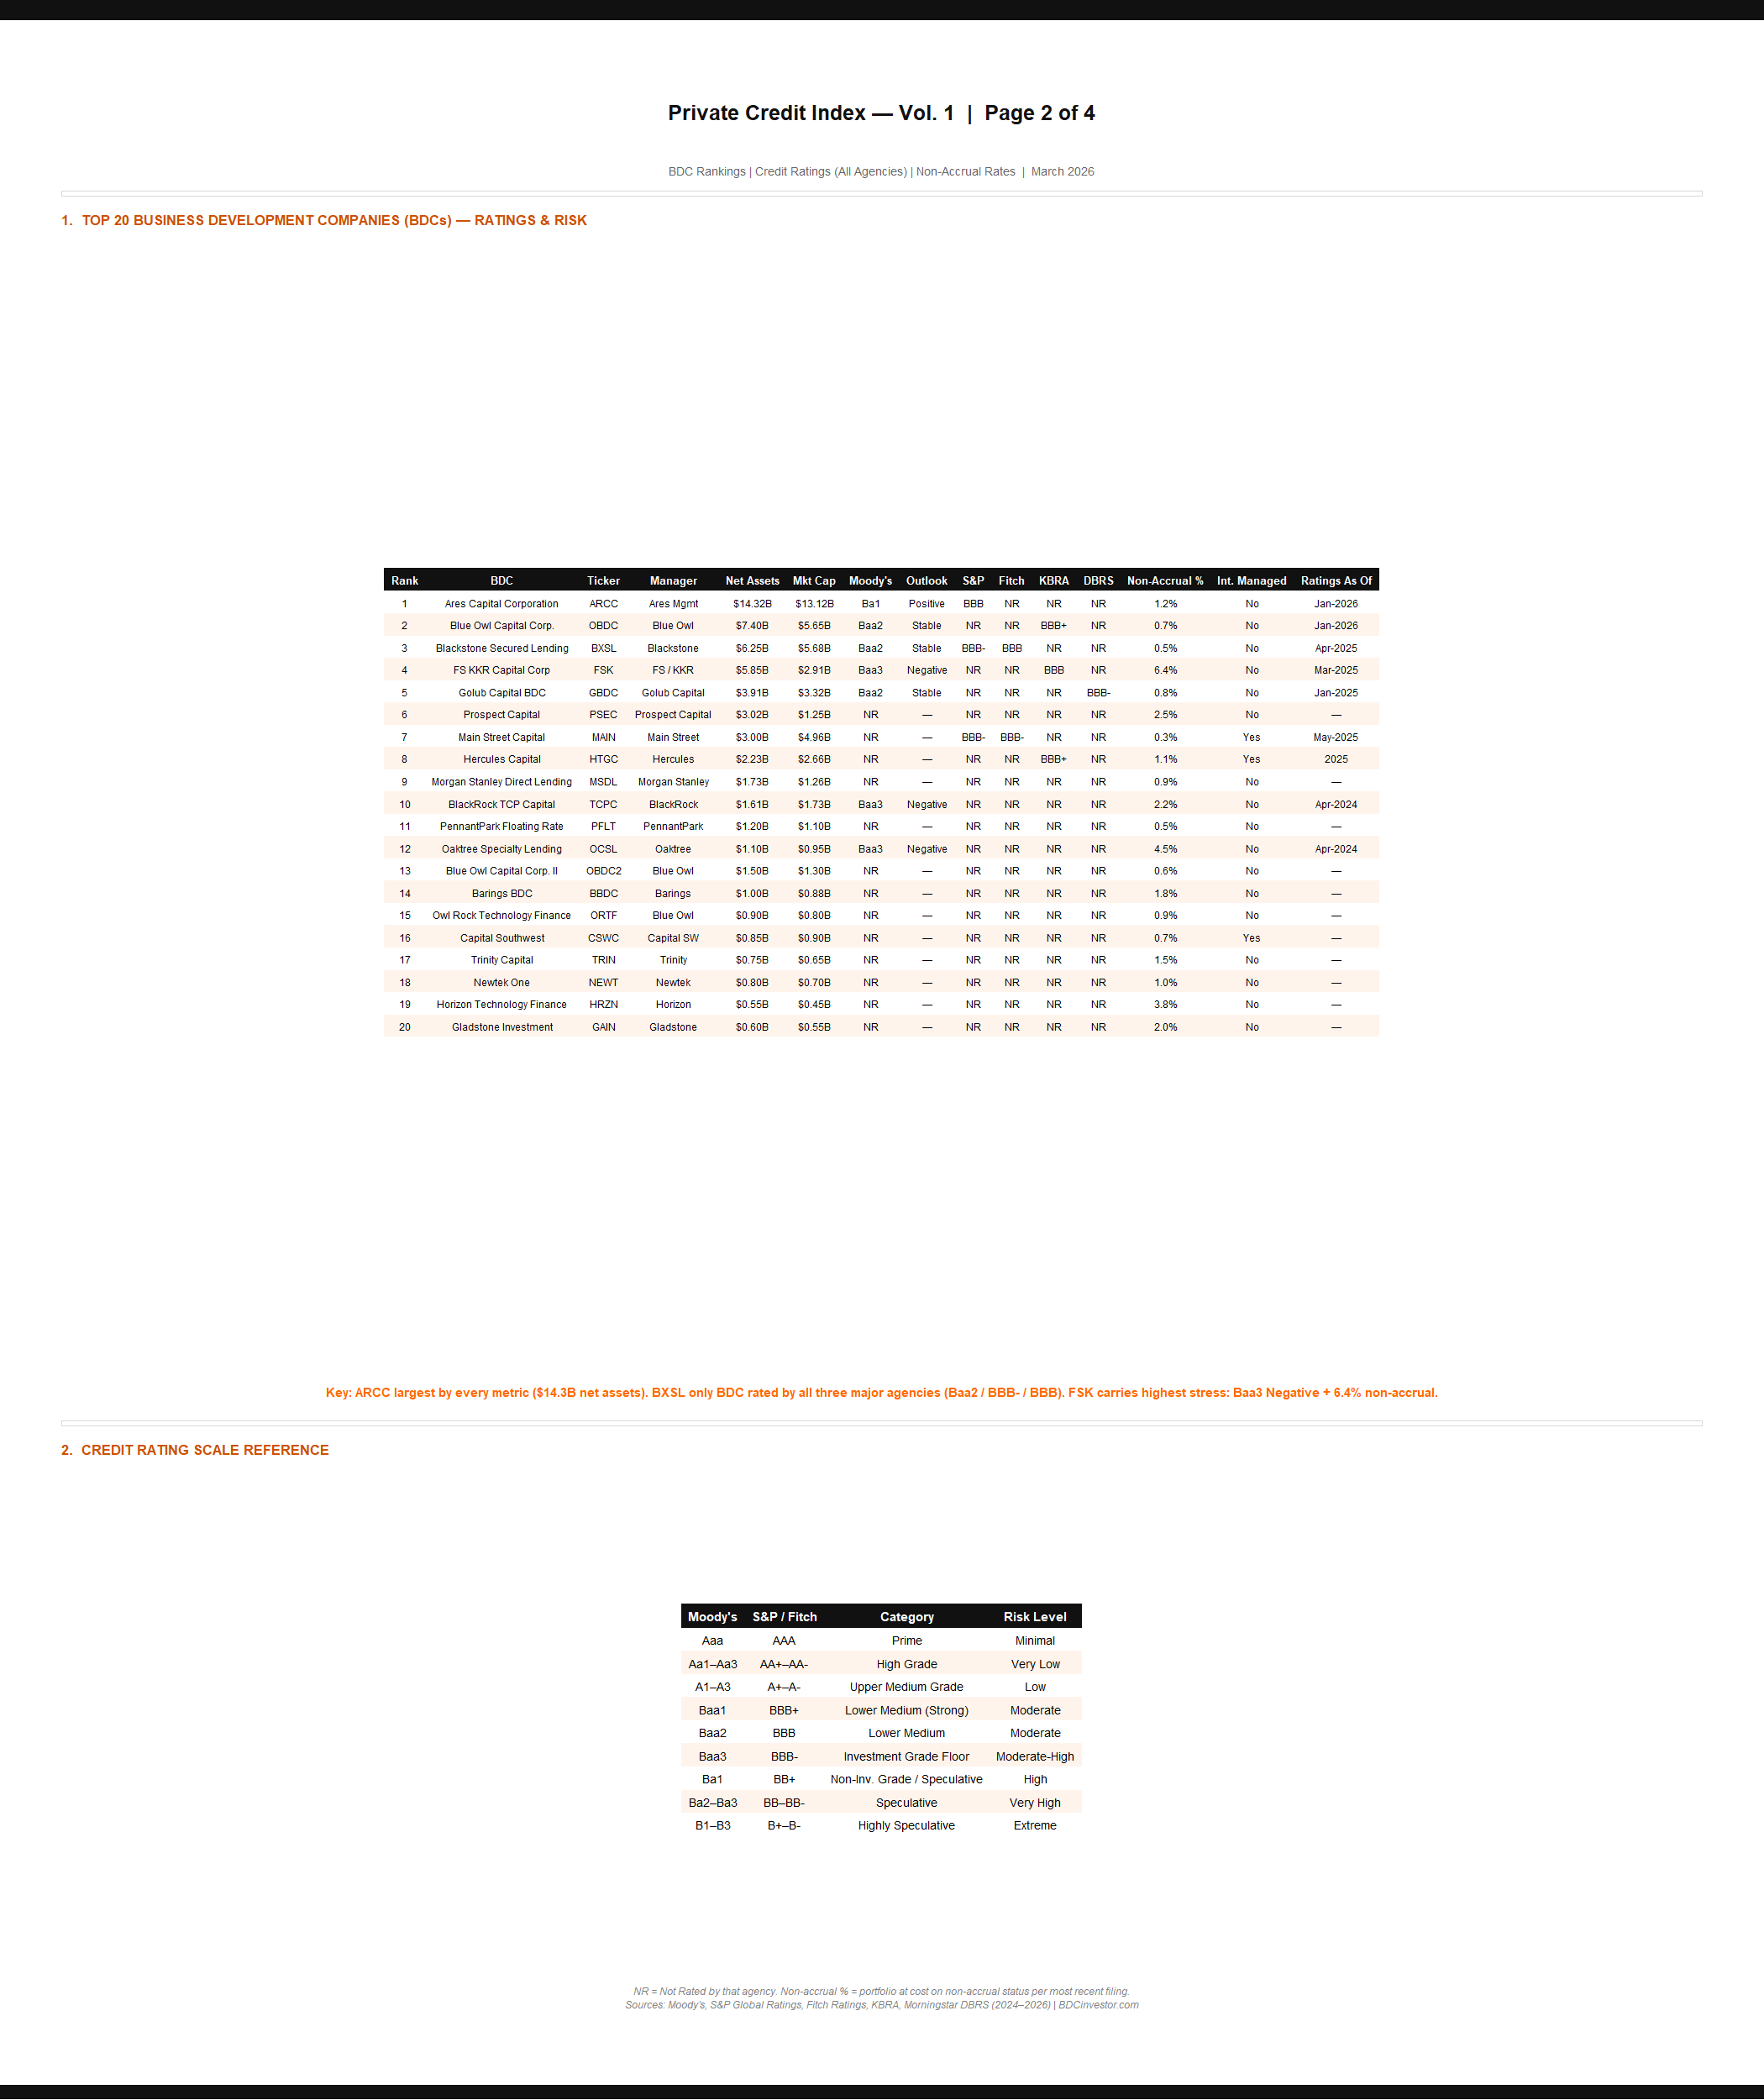
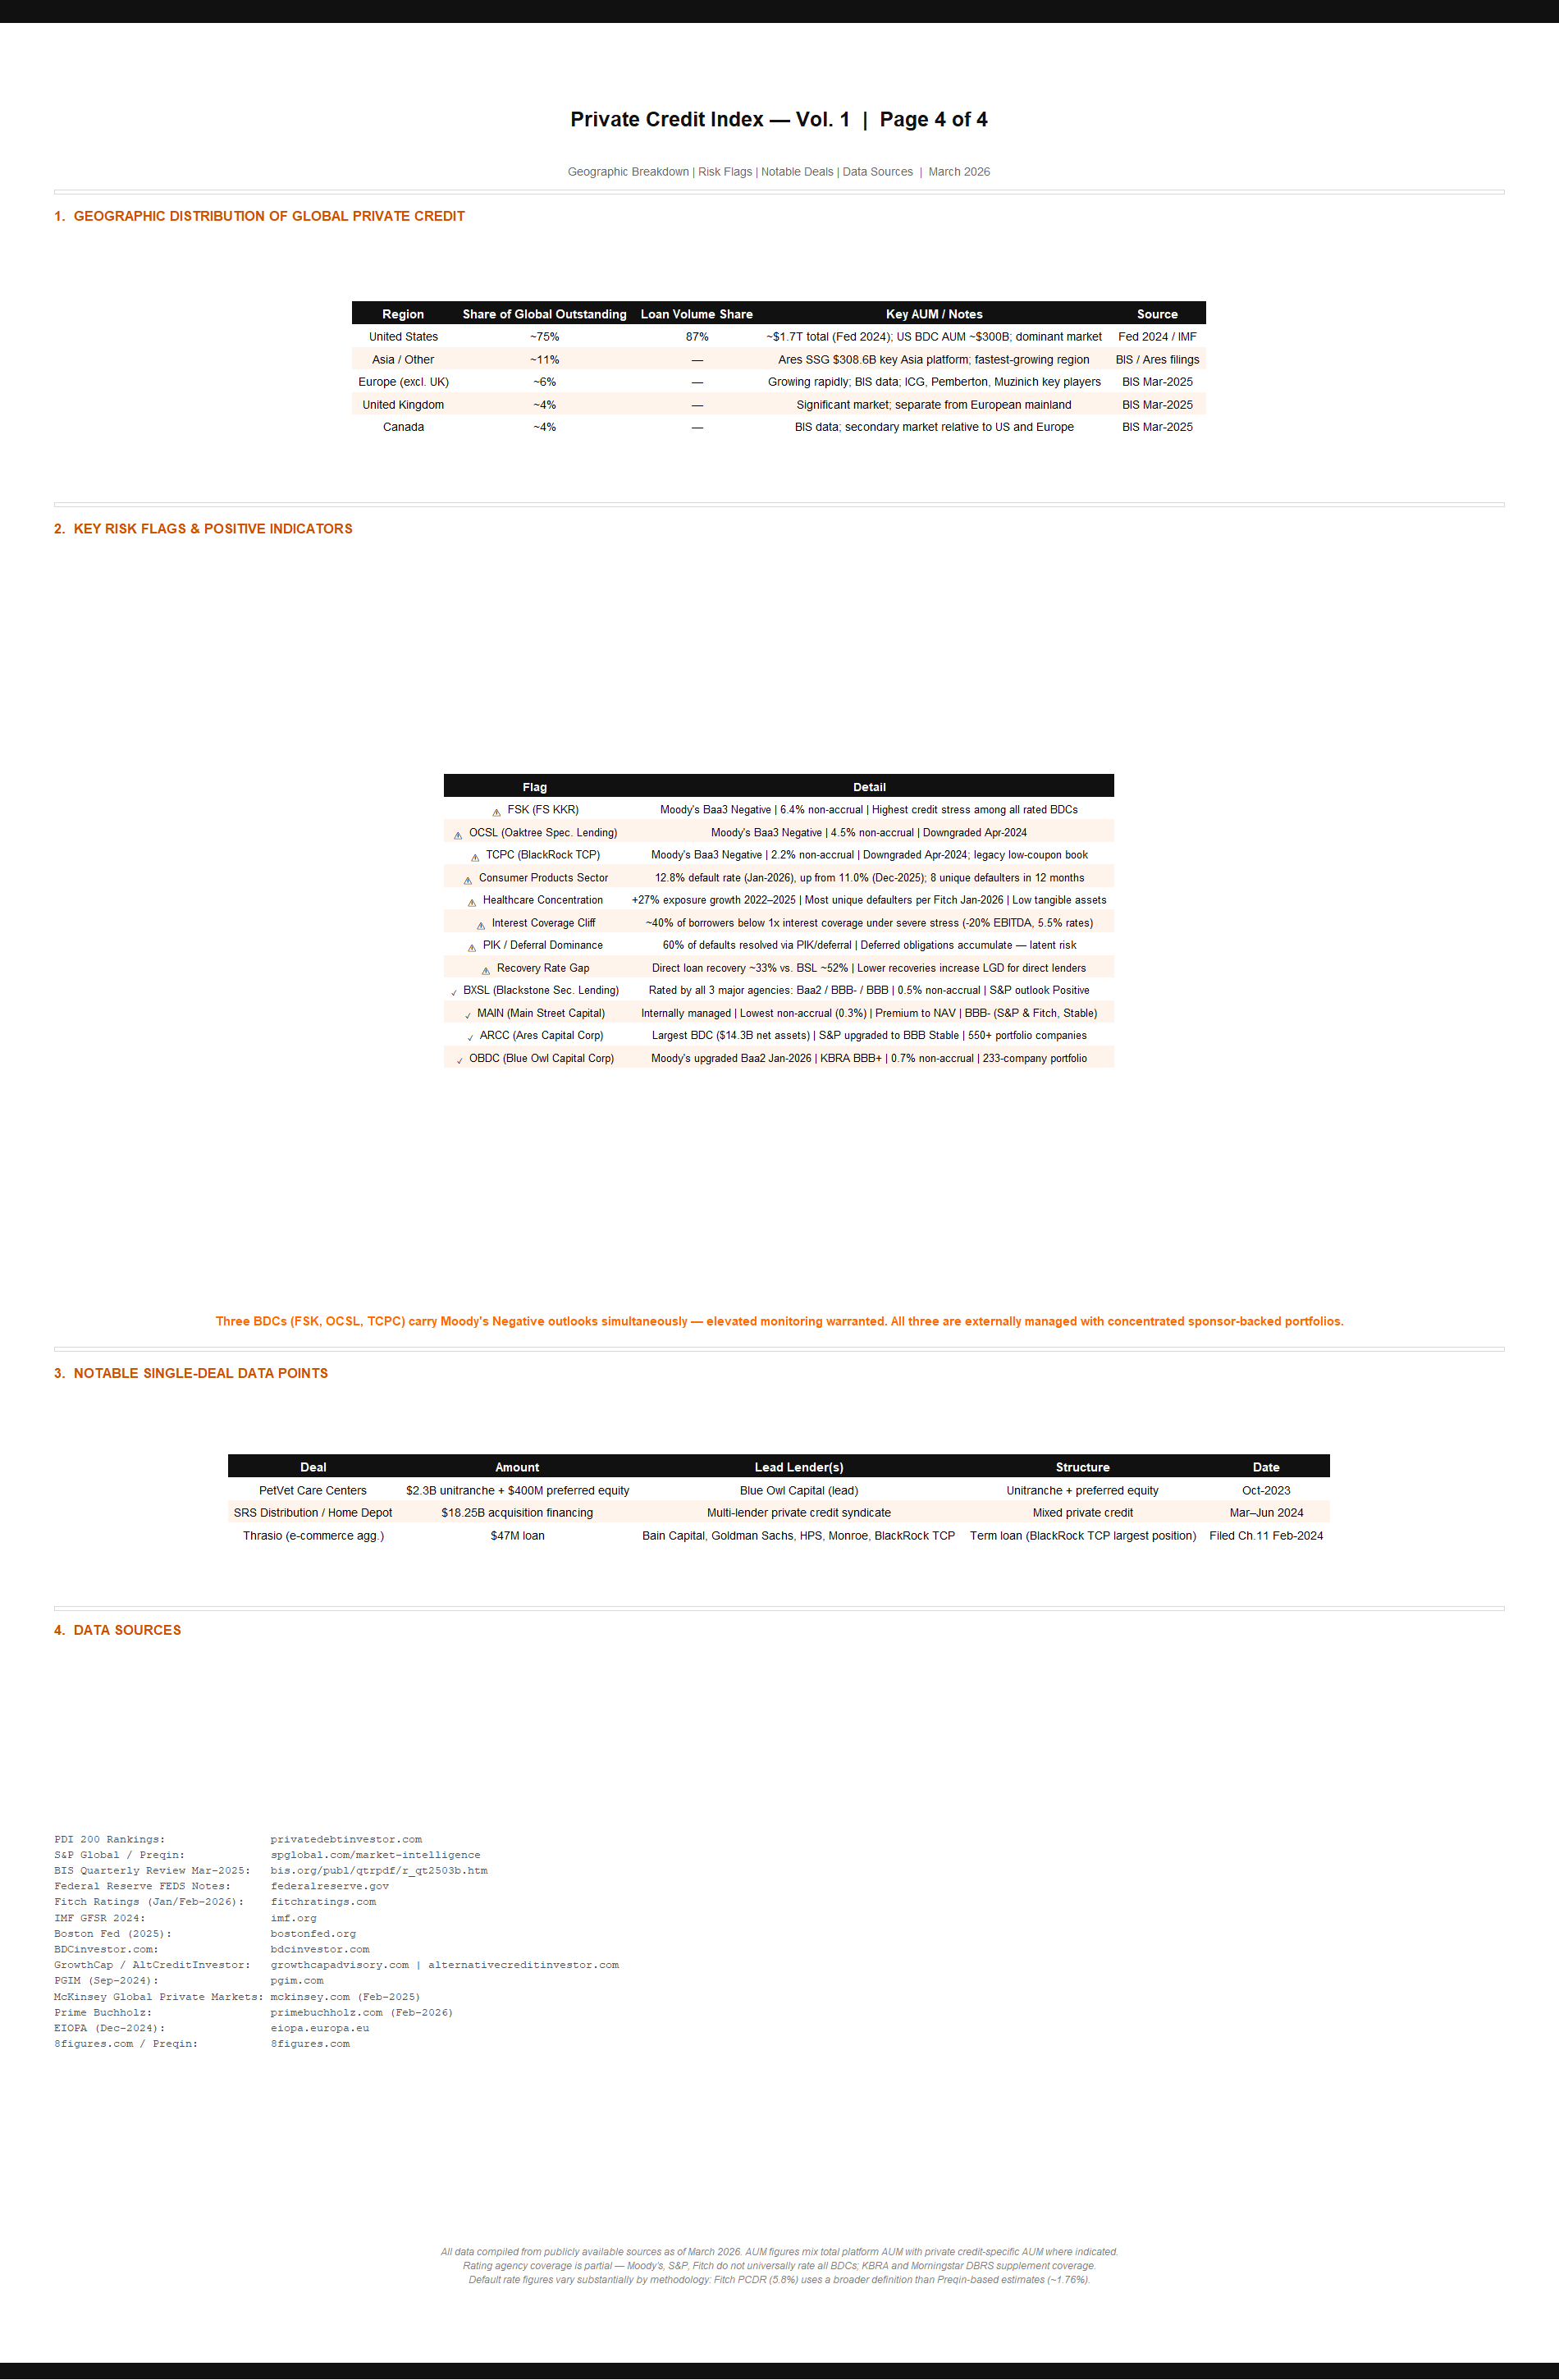
Index Tables
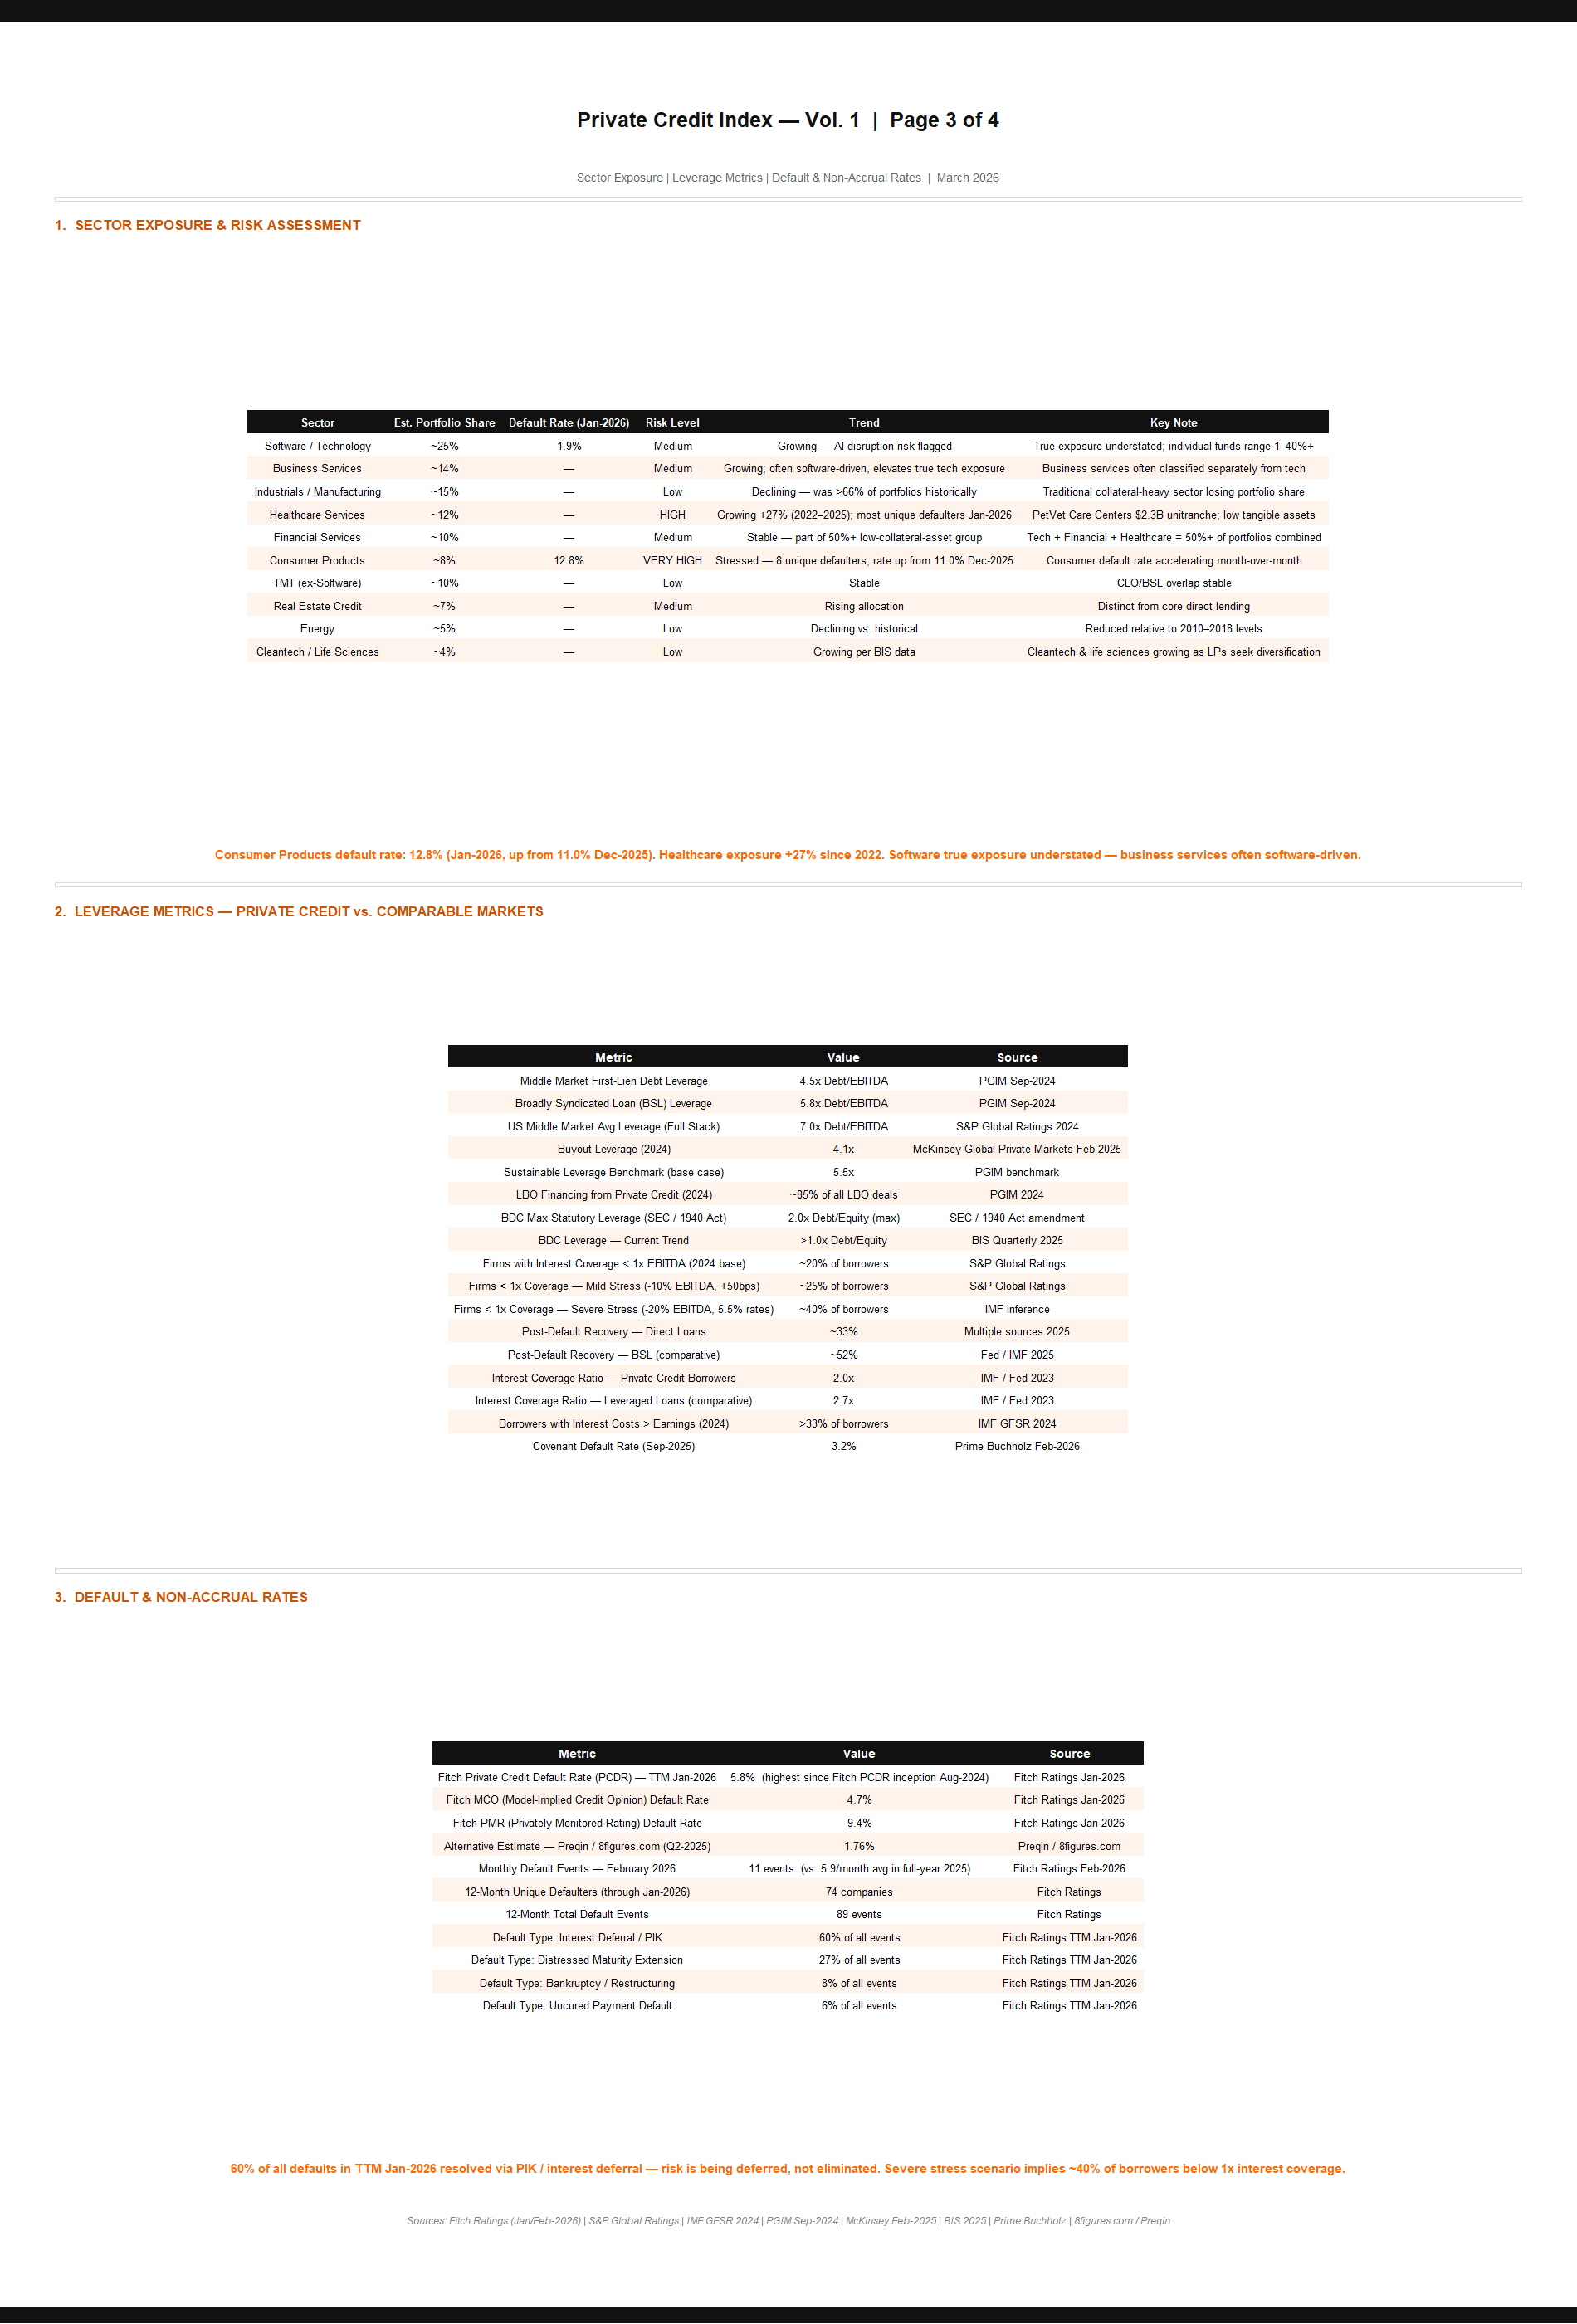
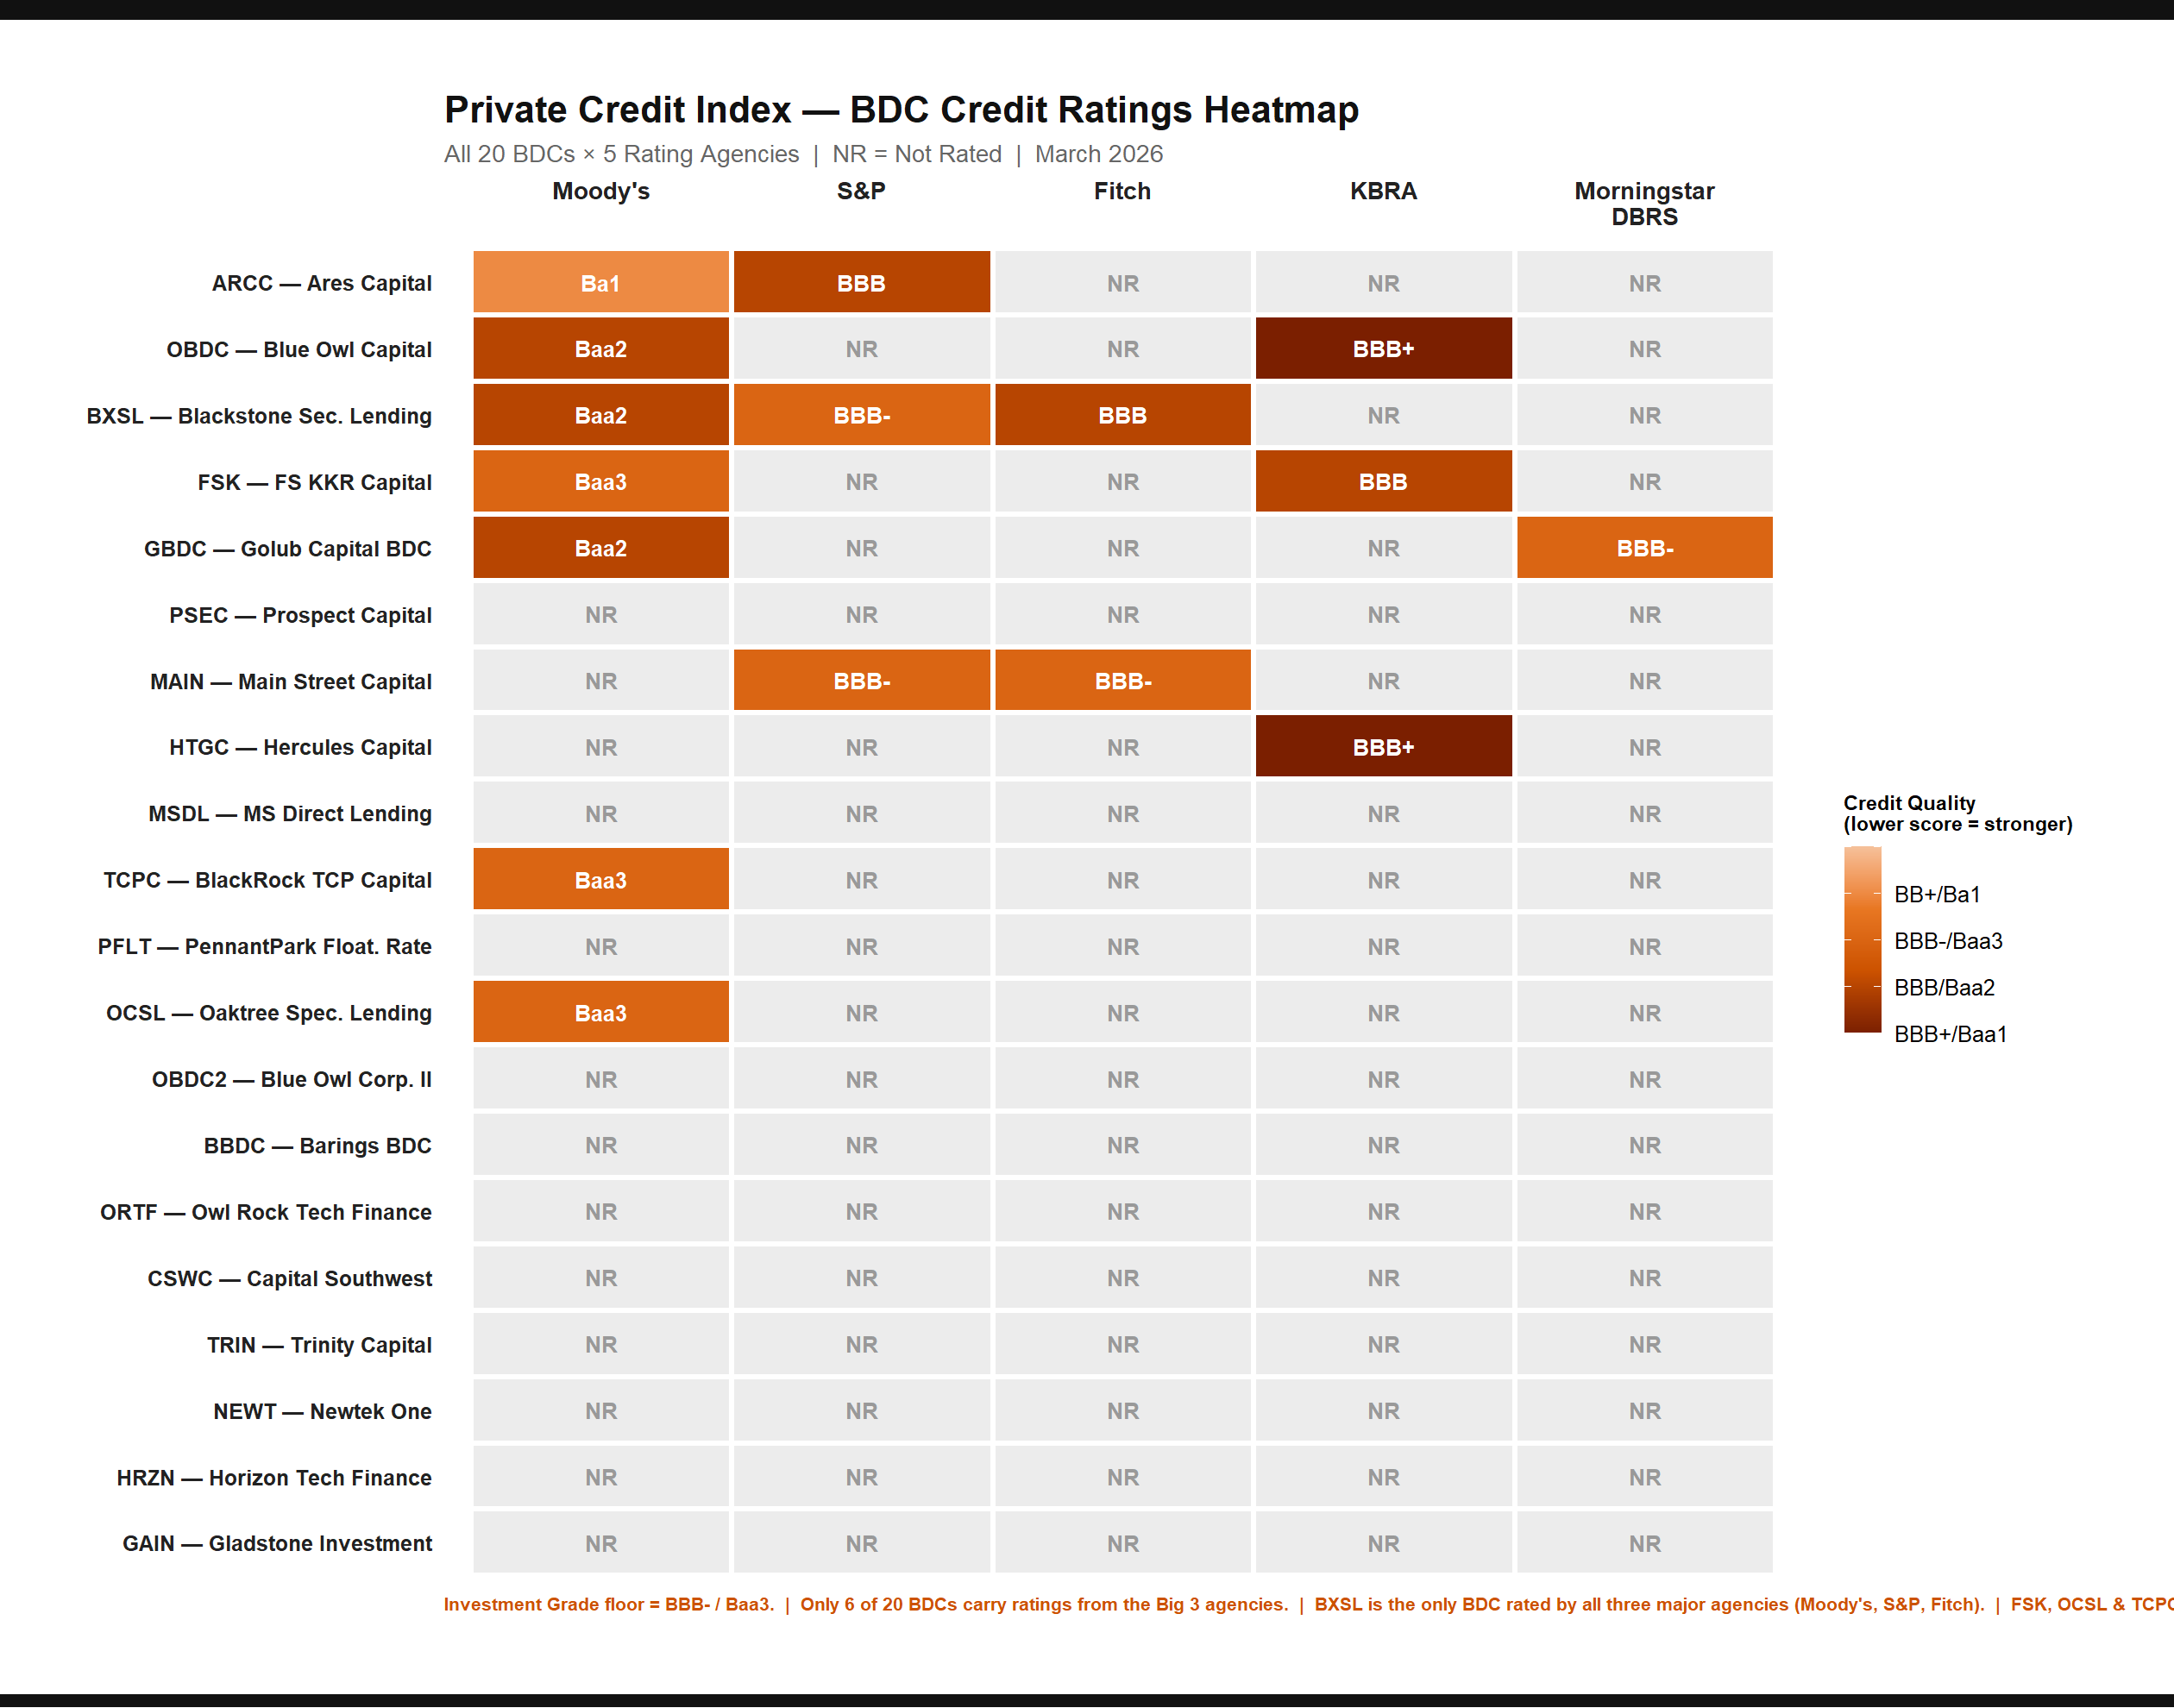
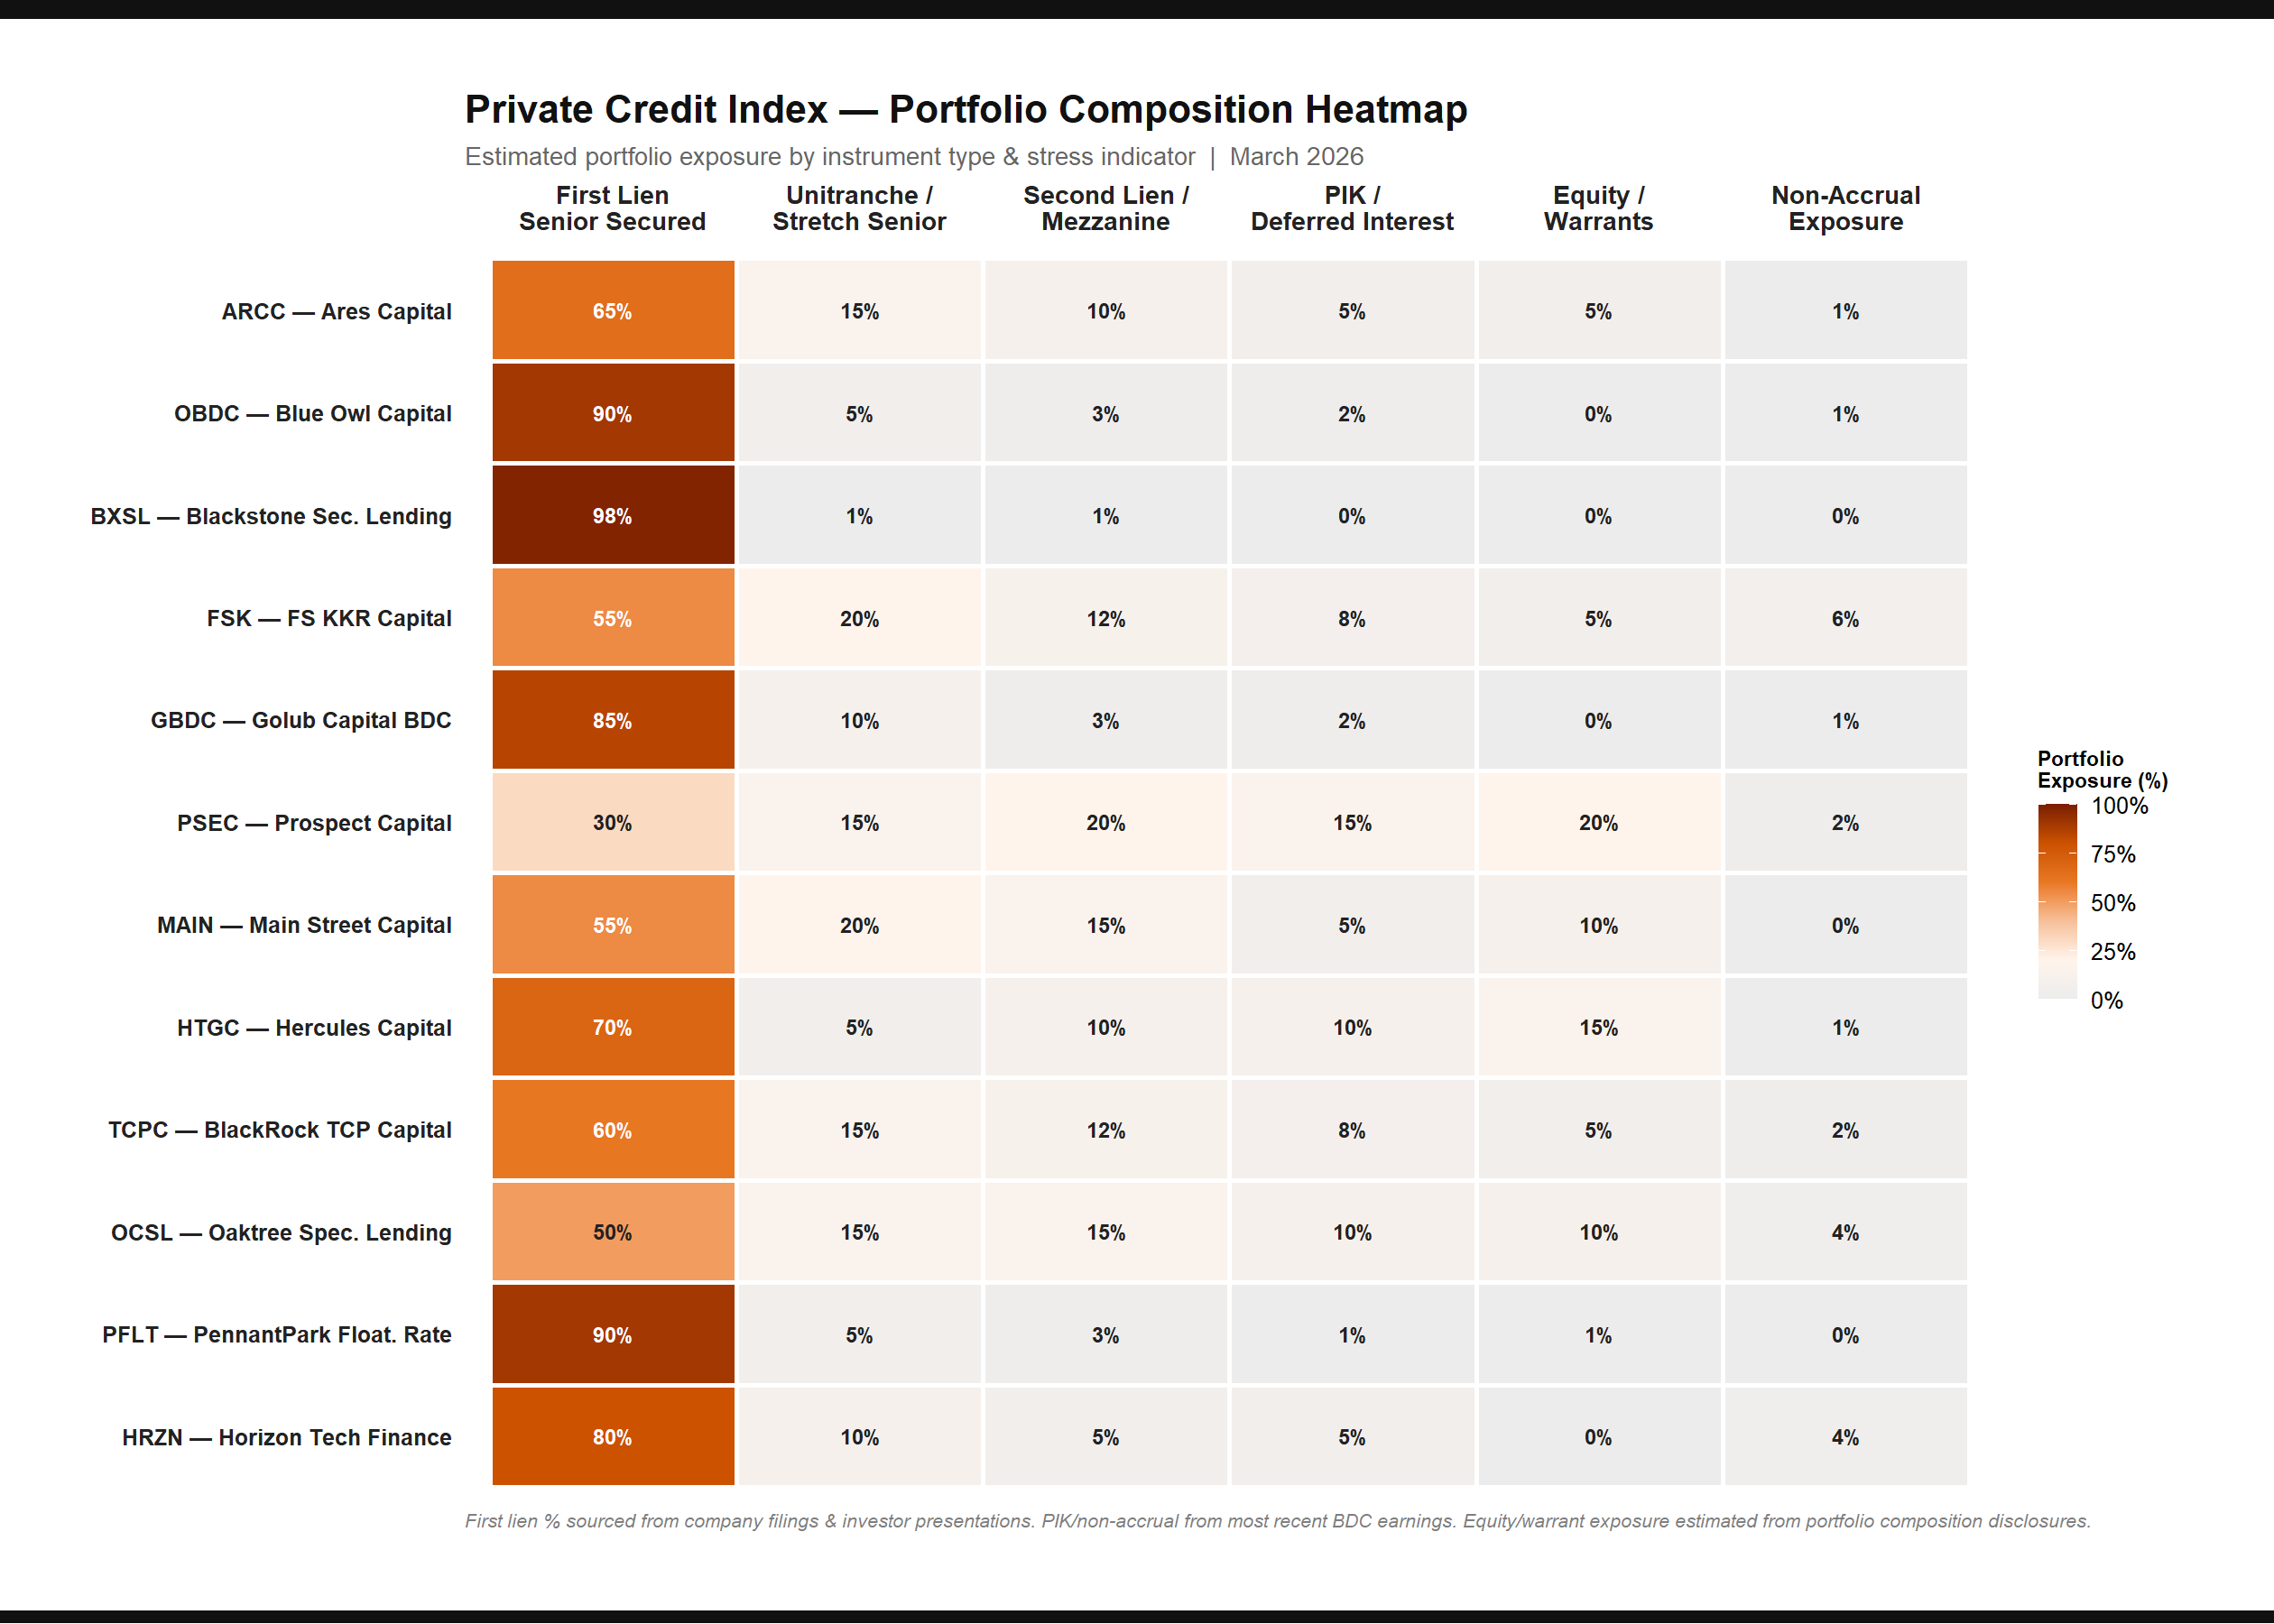
Heatmaps
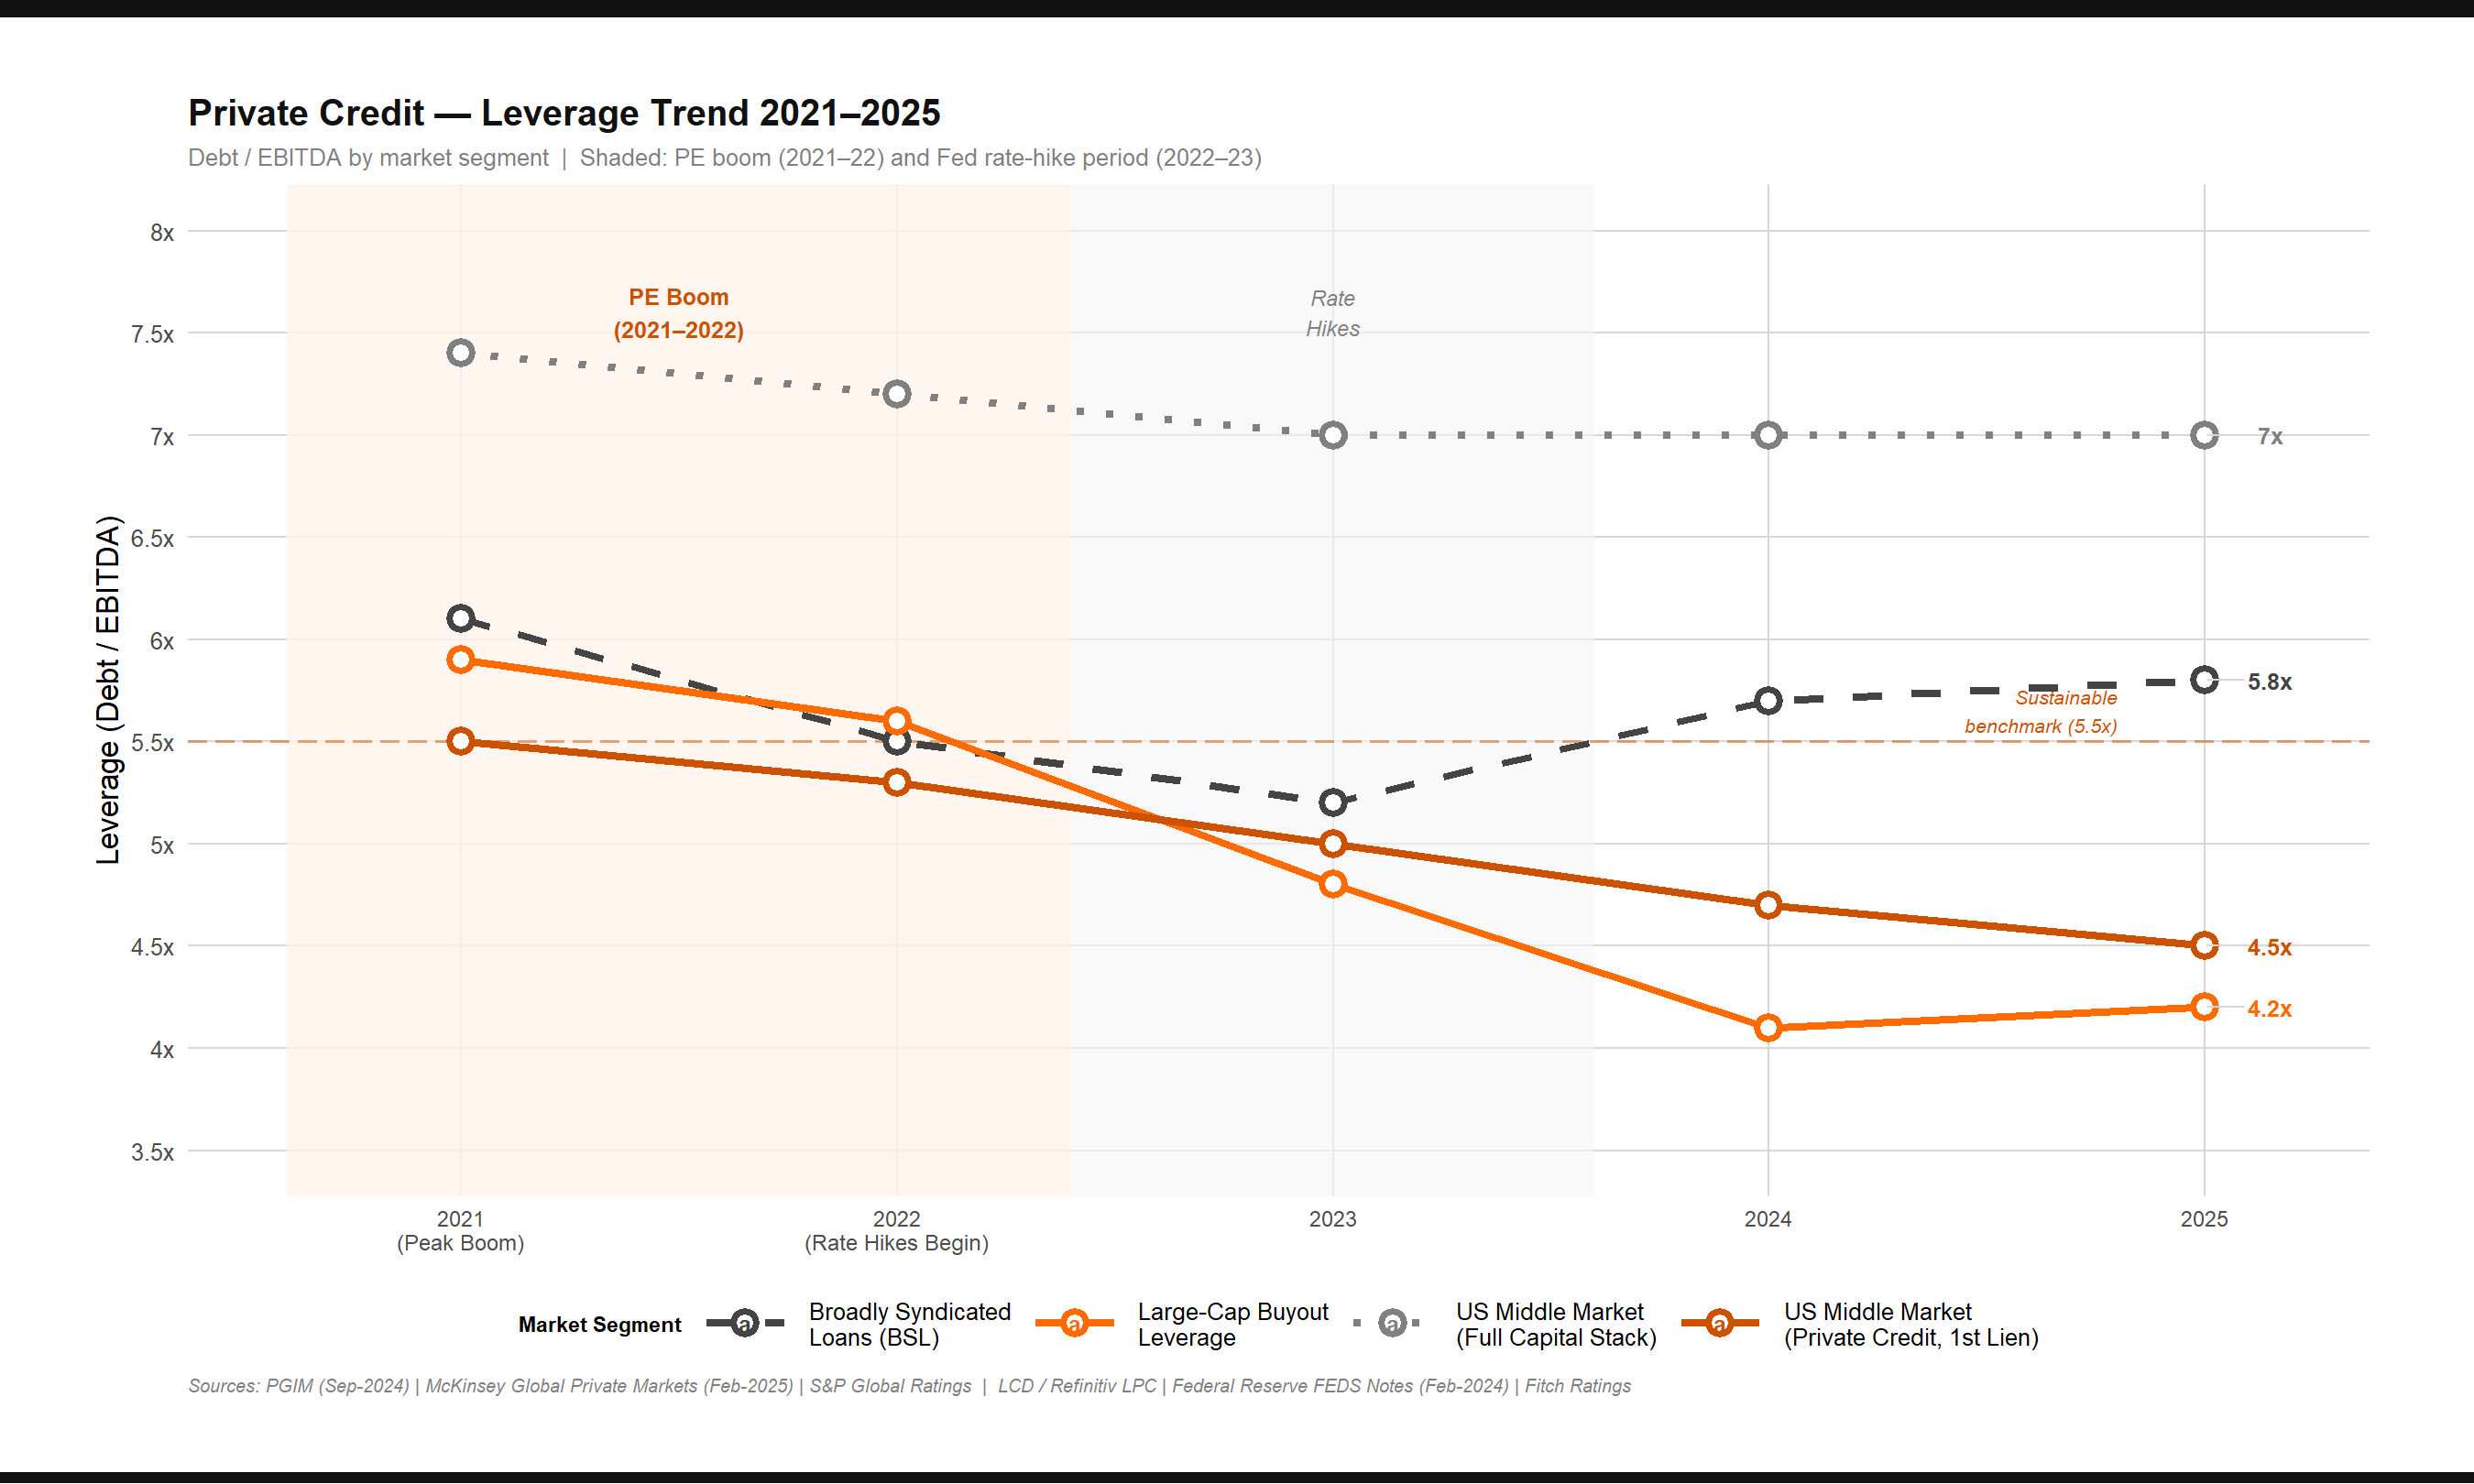
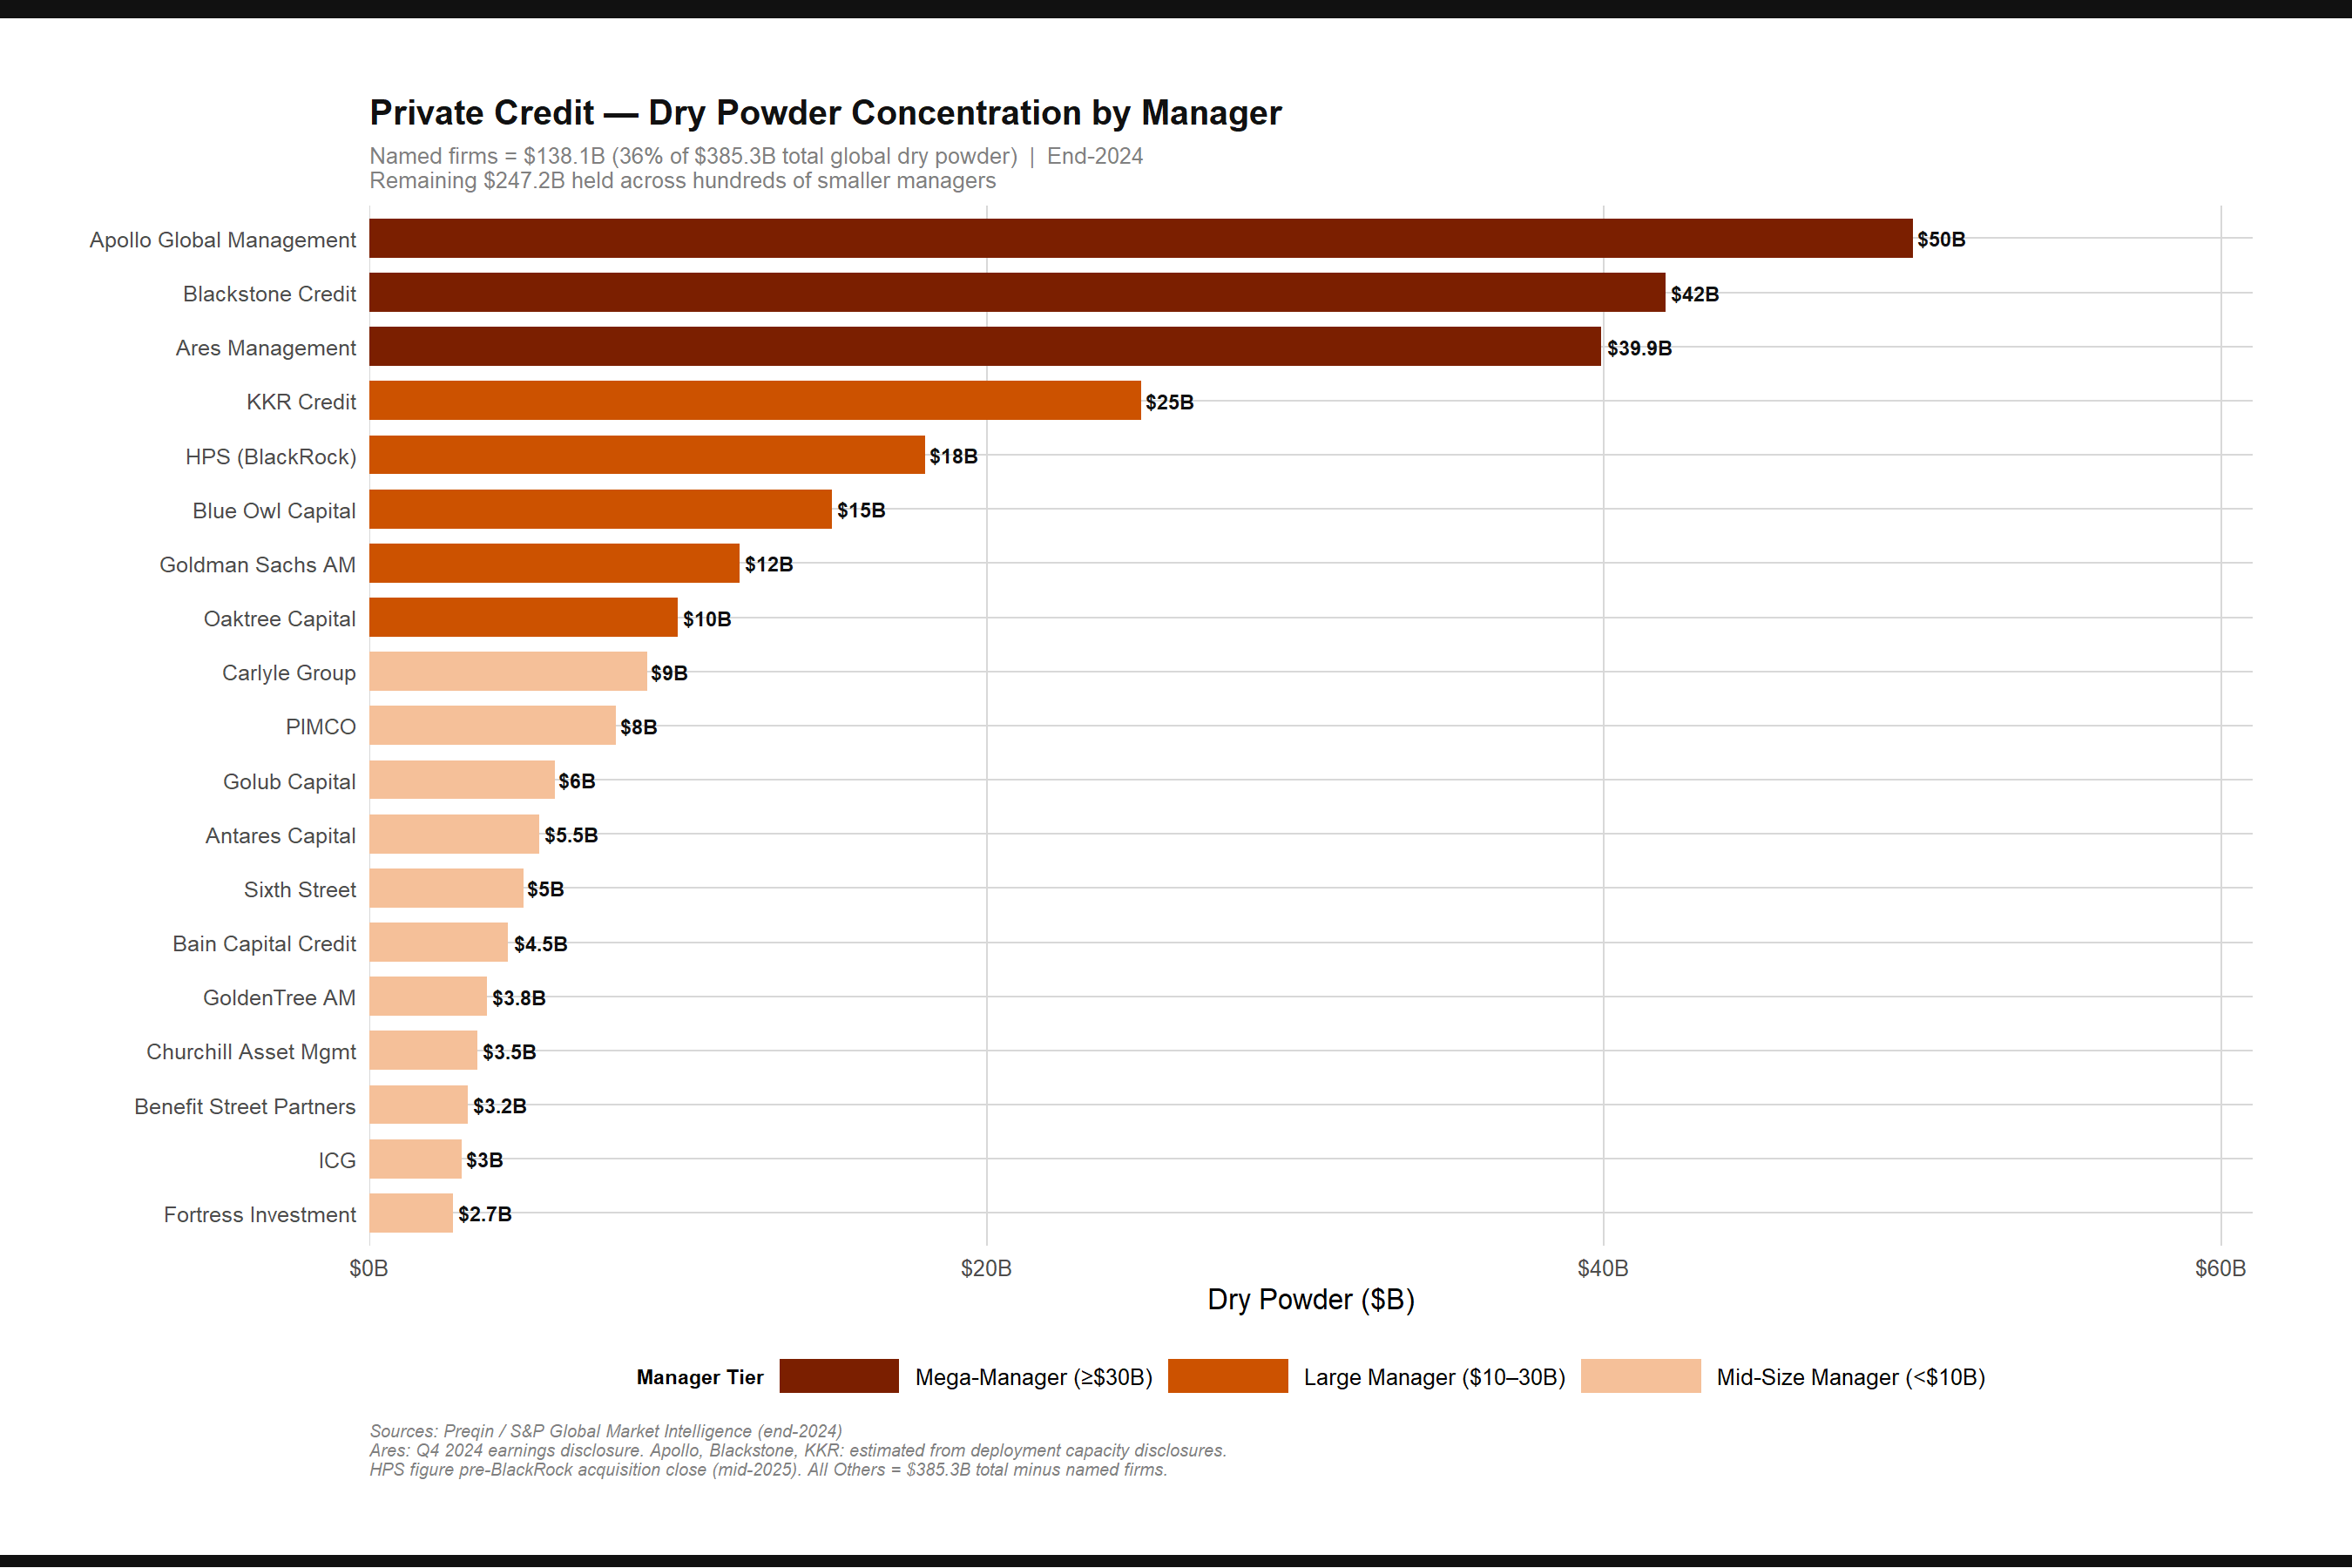
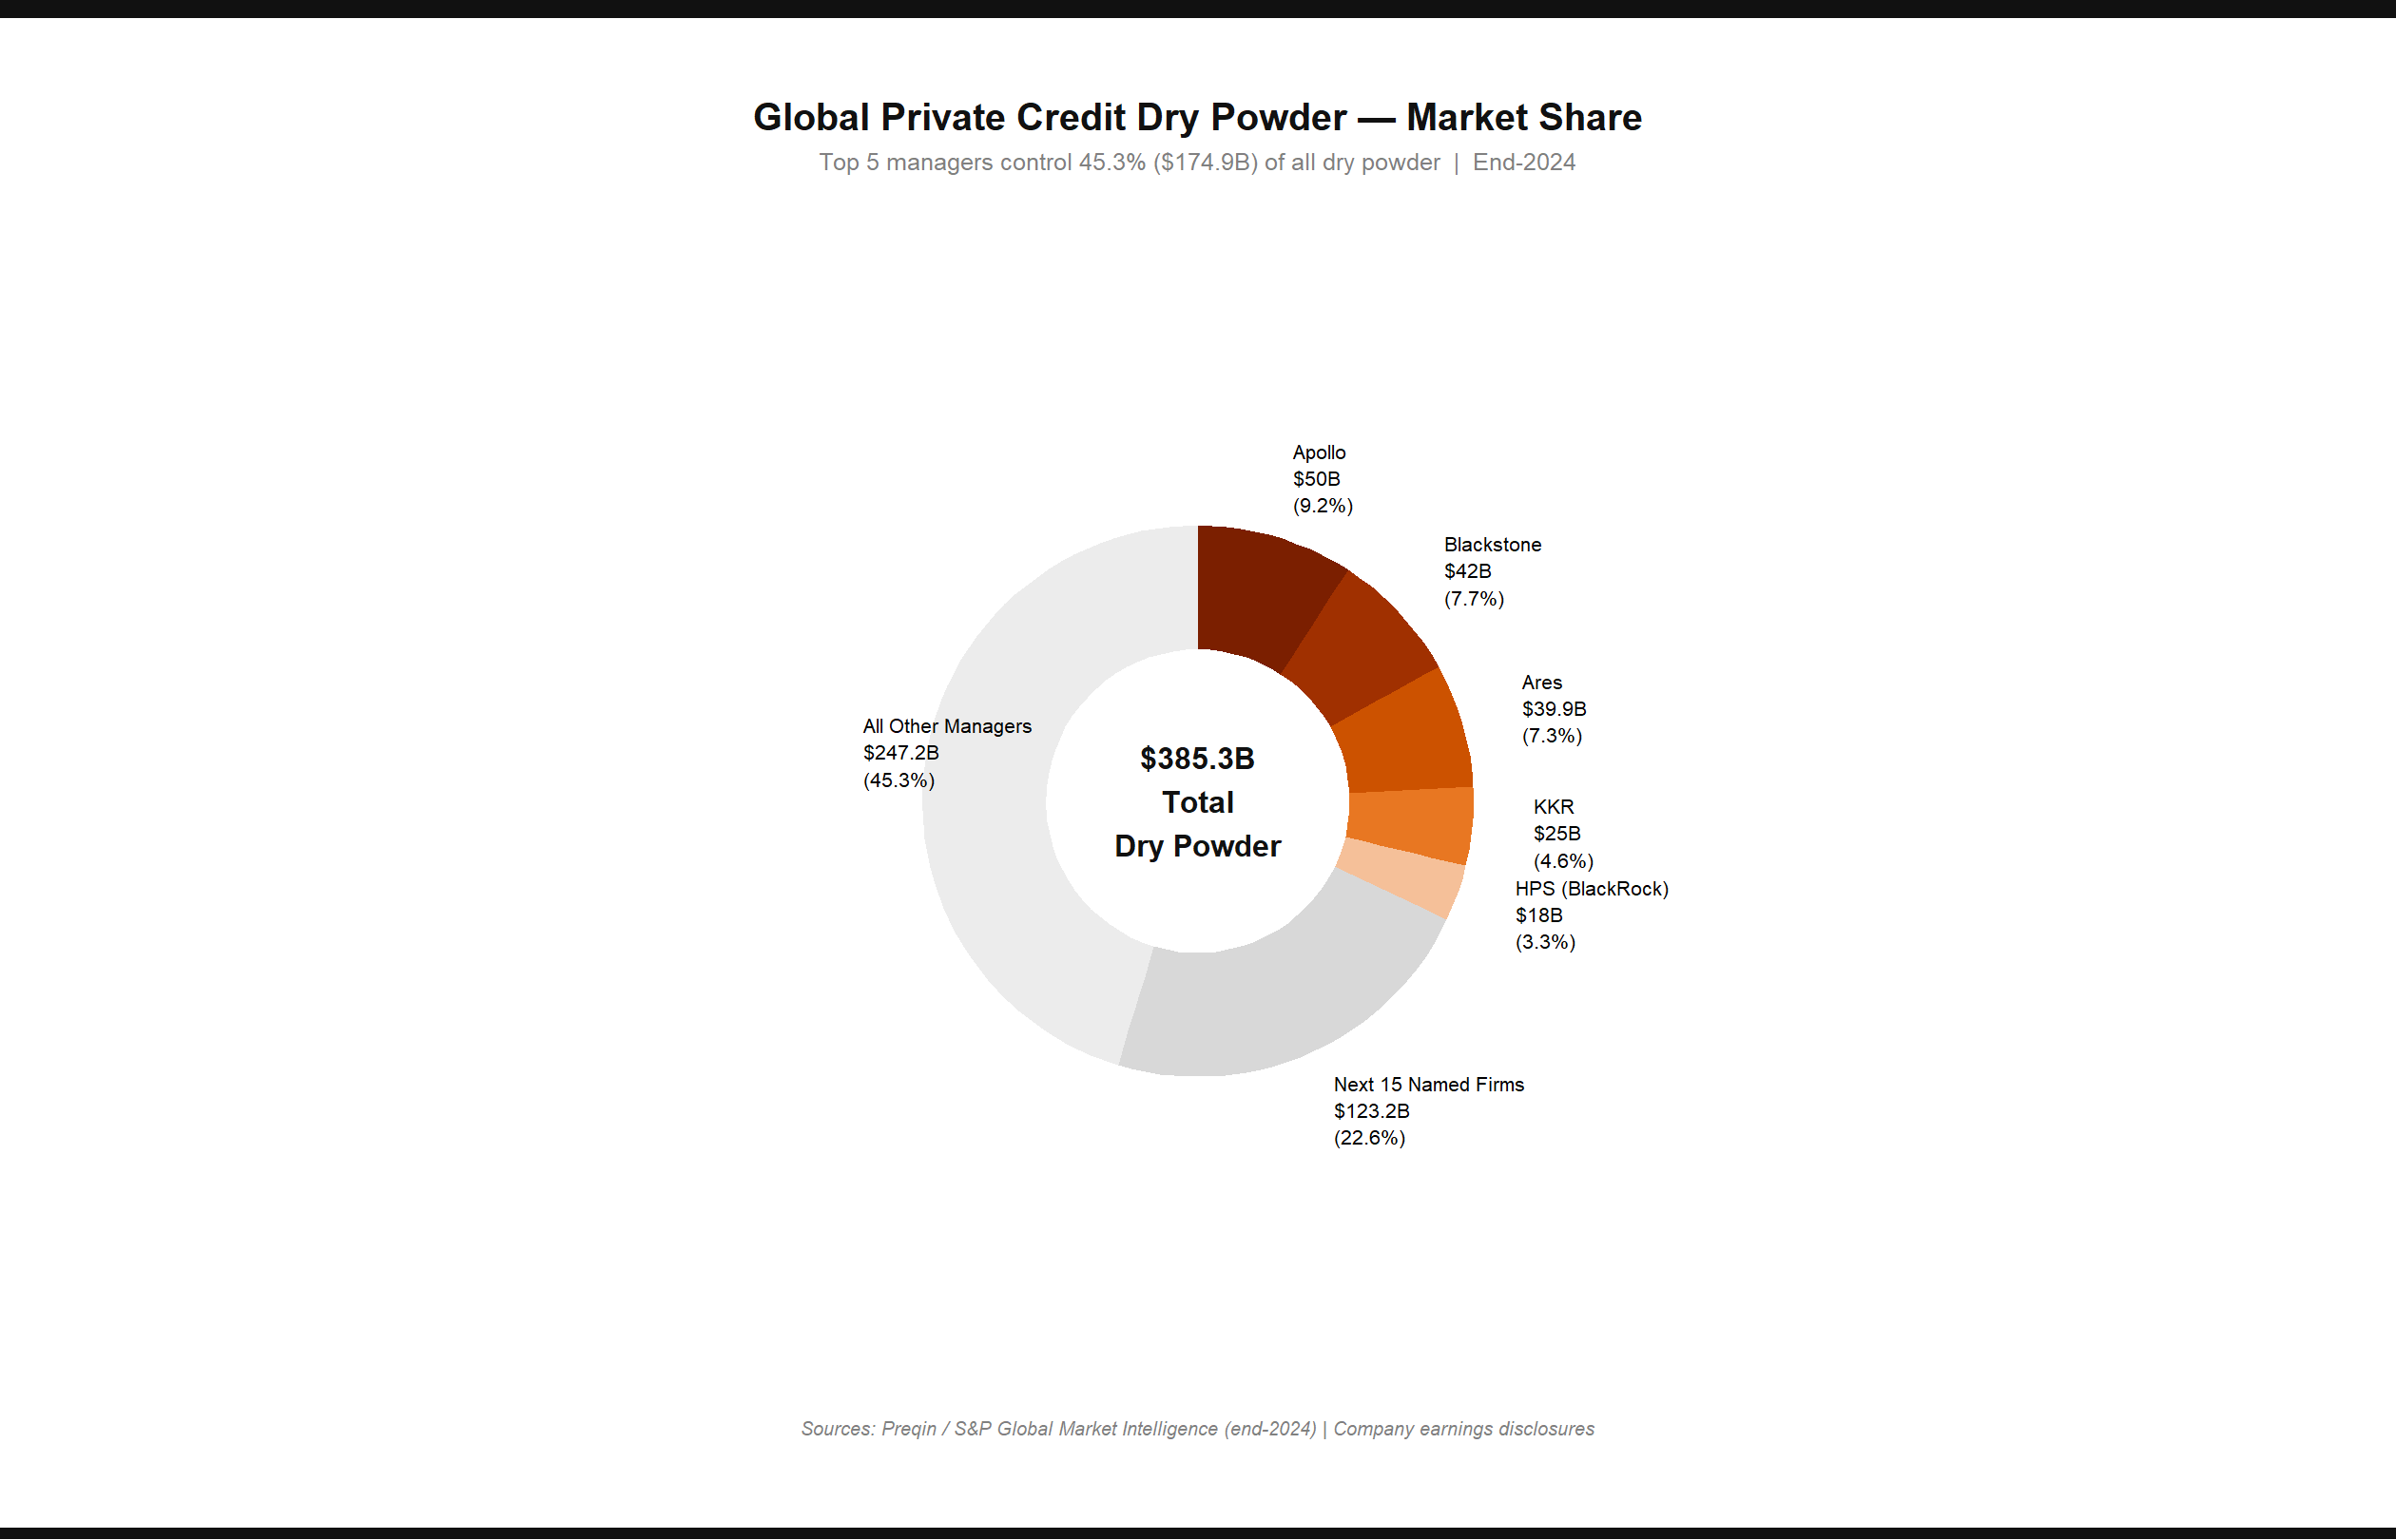
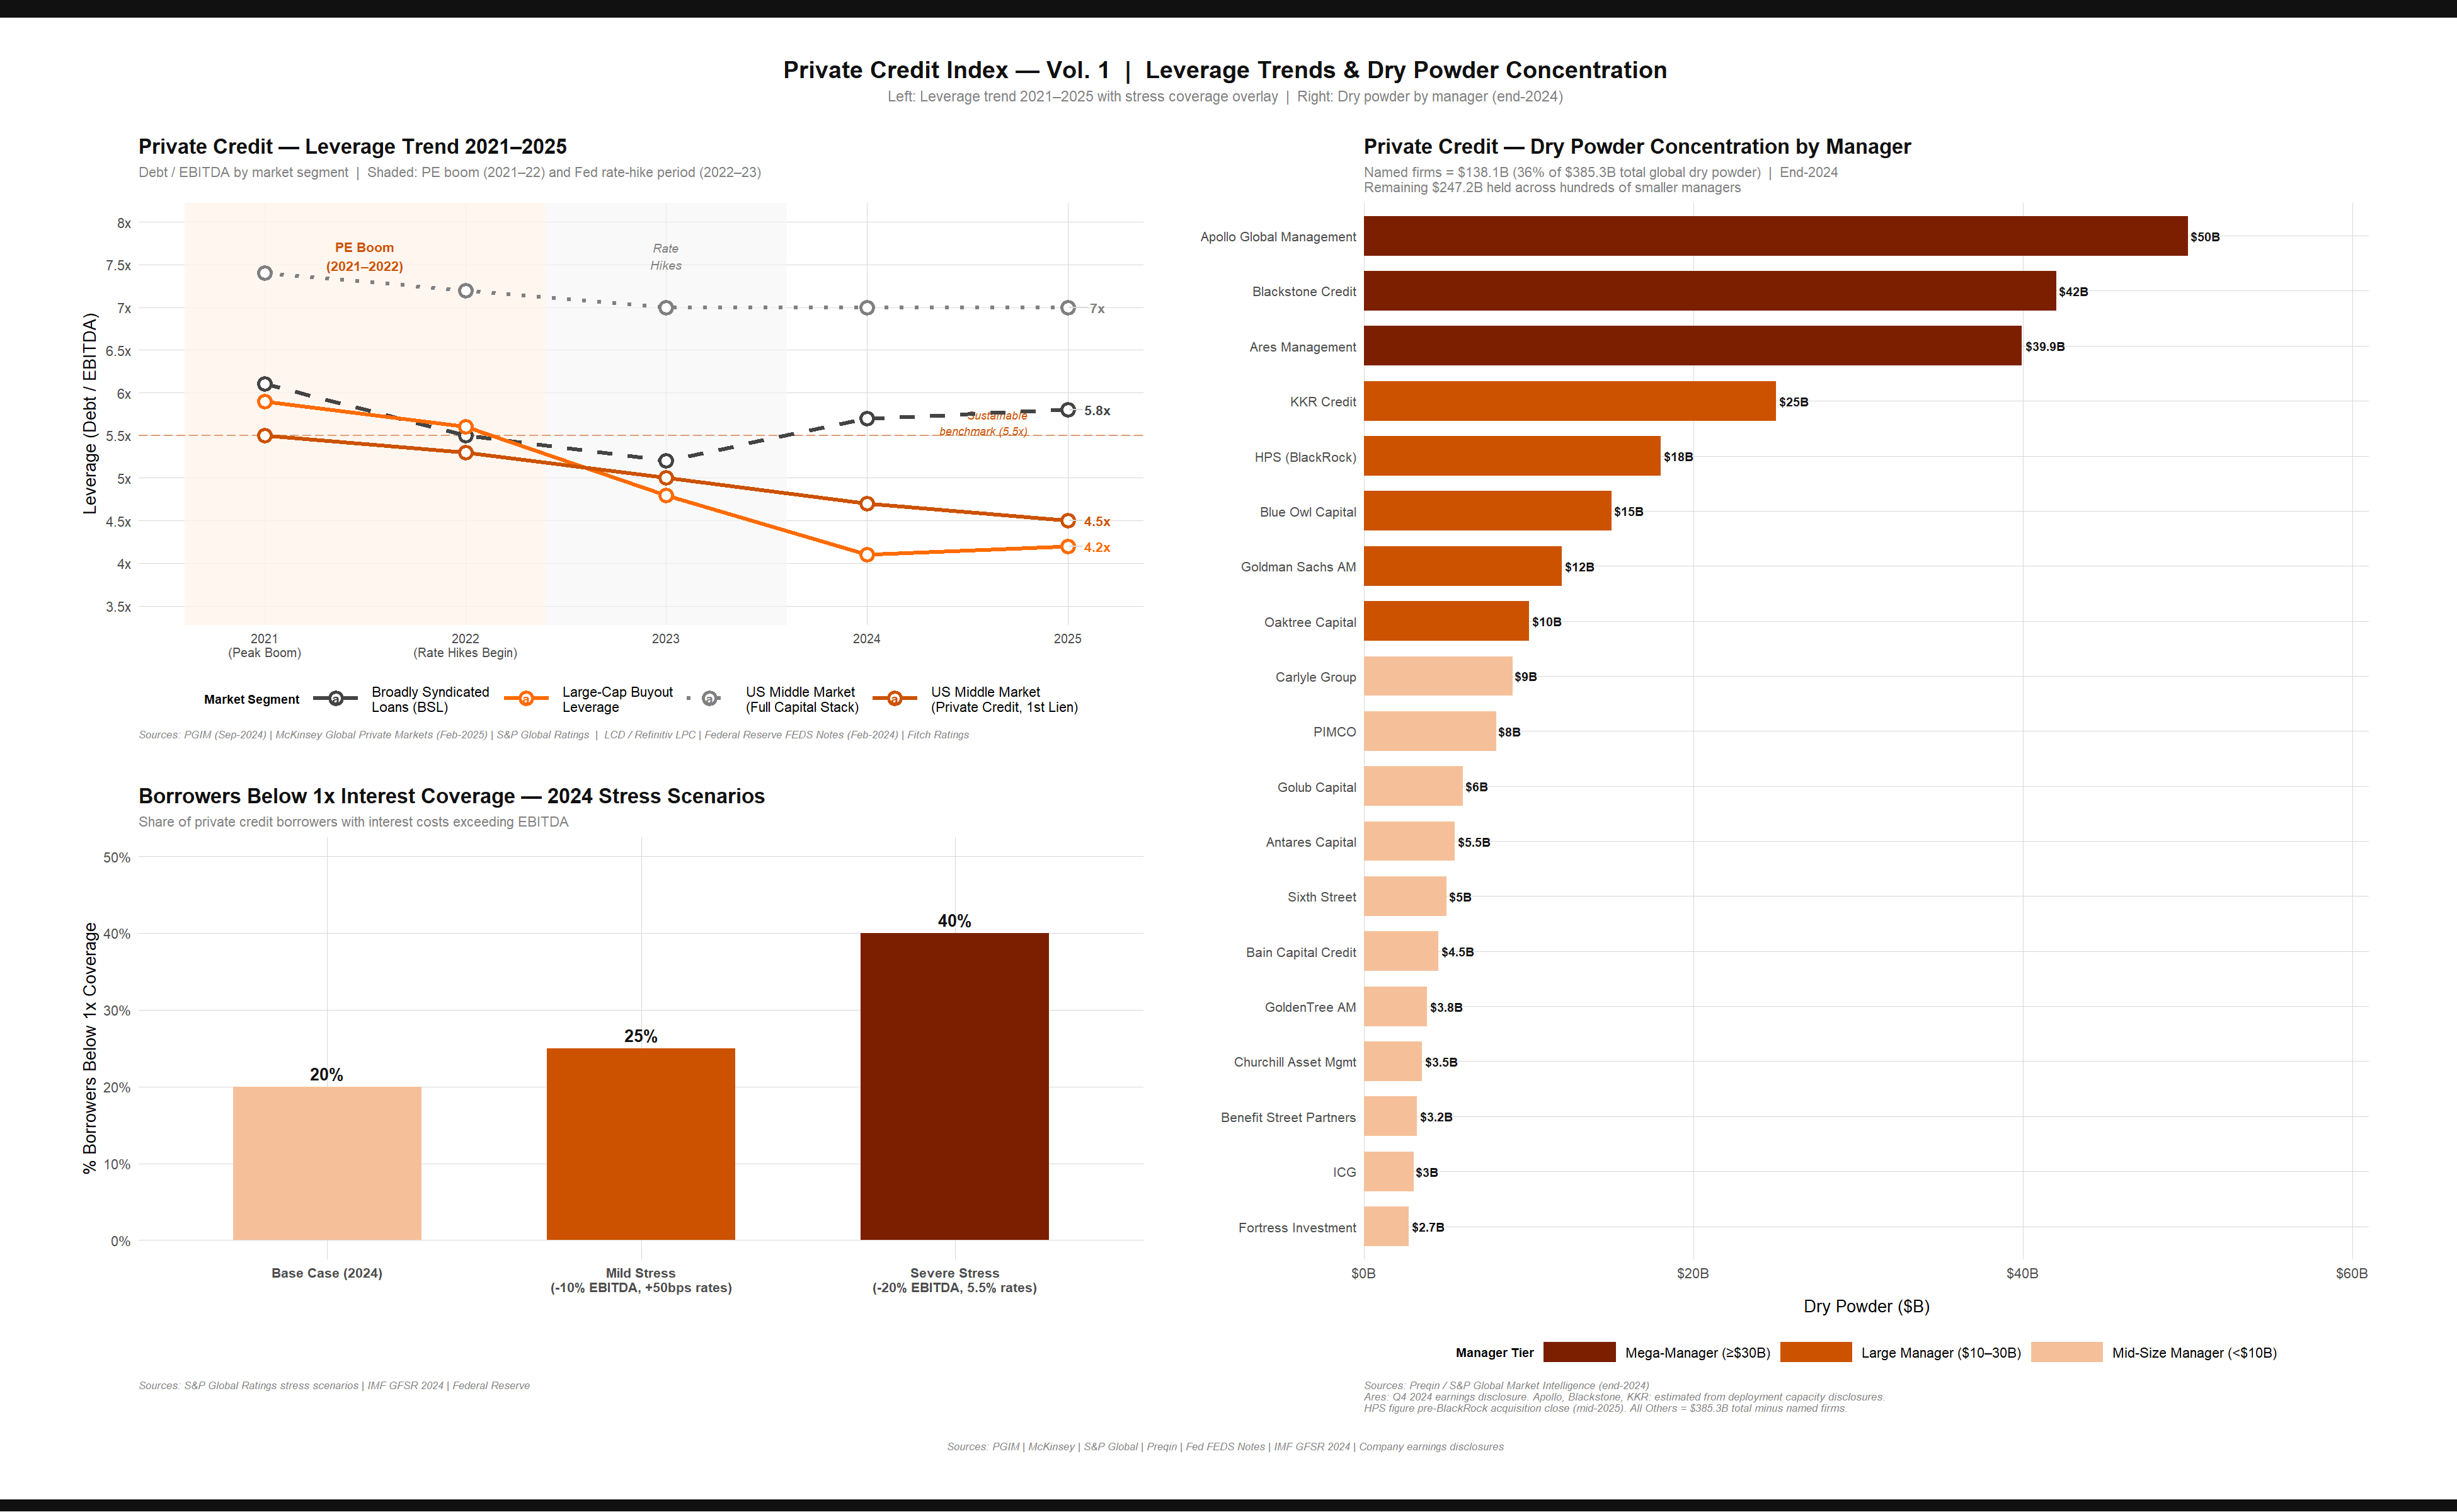
Leverage & Dry Powder