Vol. 1 — Market Overview Vol. 2 — Firm Deep-Dives Vol. 2 Supp — PIK & Roll-Ups Vol. 2.5 — Roll-Up Audit Vol. 3 — Credit Ratings Vol. 4 — Market Structure Vol. 5 — Liquidity & Redemption
Vol. 4 — March 2026

Market Structure Deep-Dive

A structural analysis of the $3.5T private credit market: default rate methodology divergence (0.75% to 9.2%), spread compression (-160 bps since 2023), PIK shadow defaults doubling since 2021, credit secondaries surging to $20B, CLO formation at record $203B, and the growing role of insurance capital and retail allocation in reshaping the investor base.

Vol. 4 — Market Structure Deep-Dive

Structural Forces Reshaping Private Credit

Key Findings

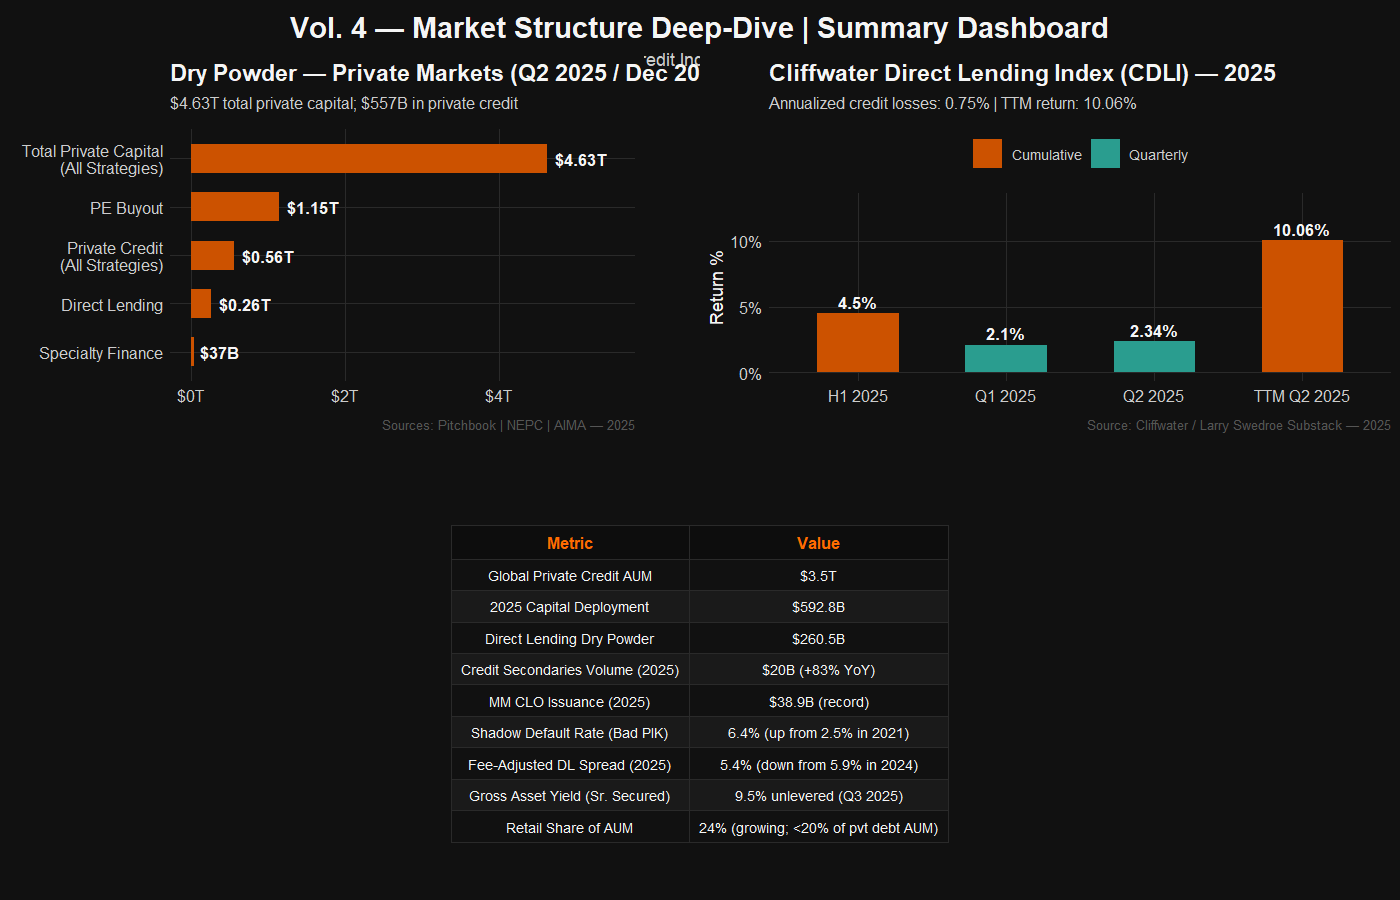
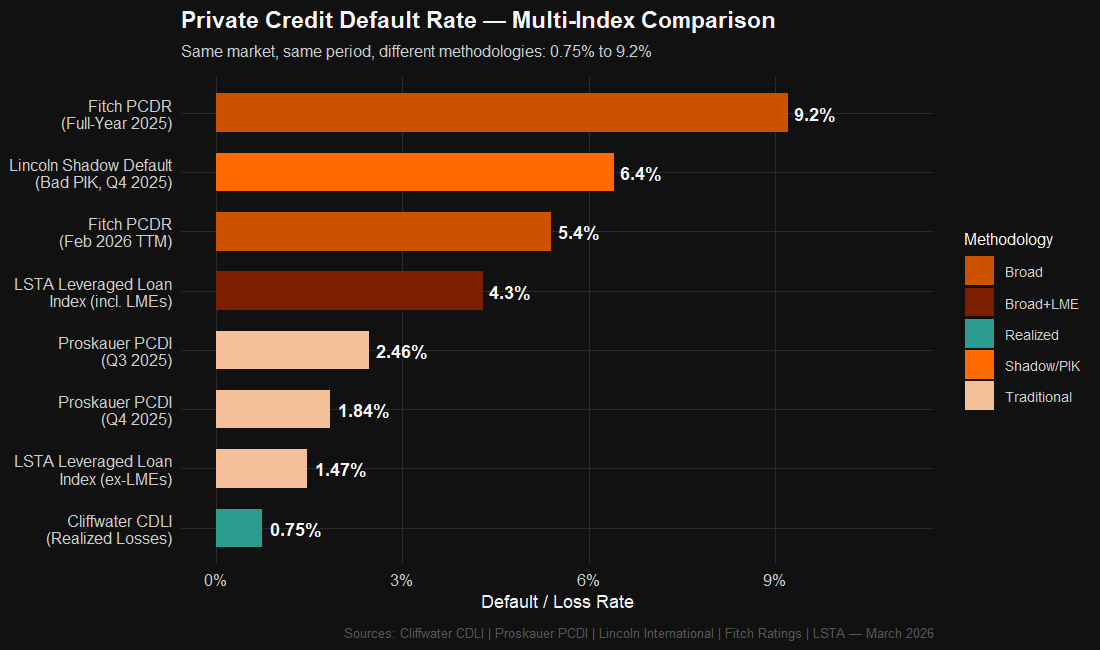
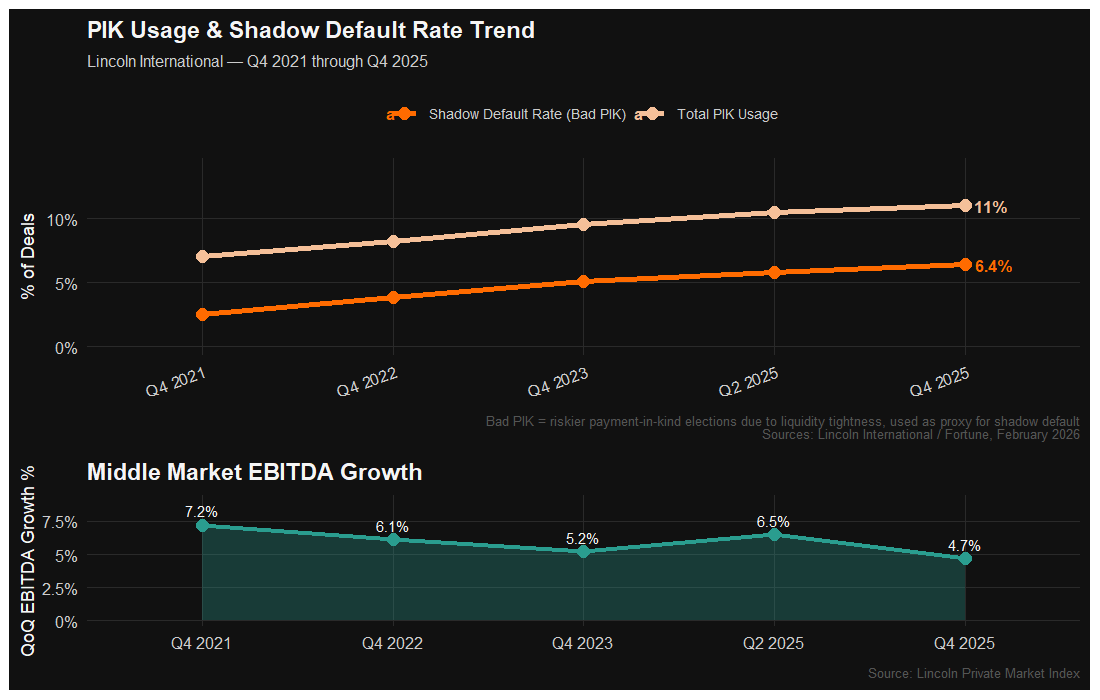
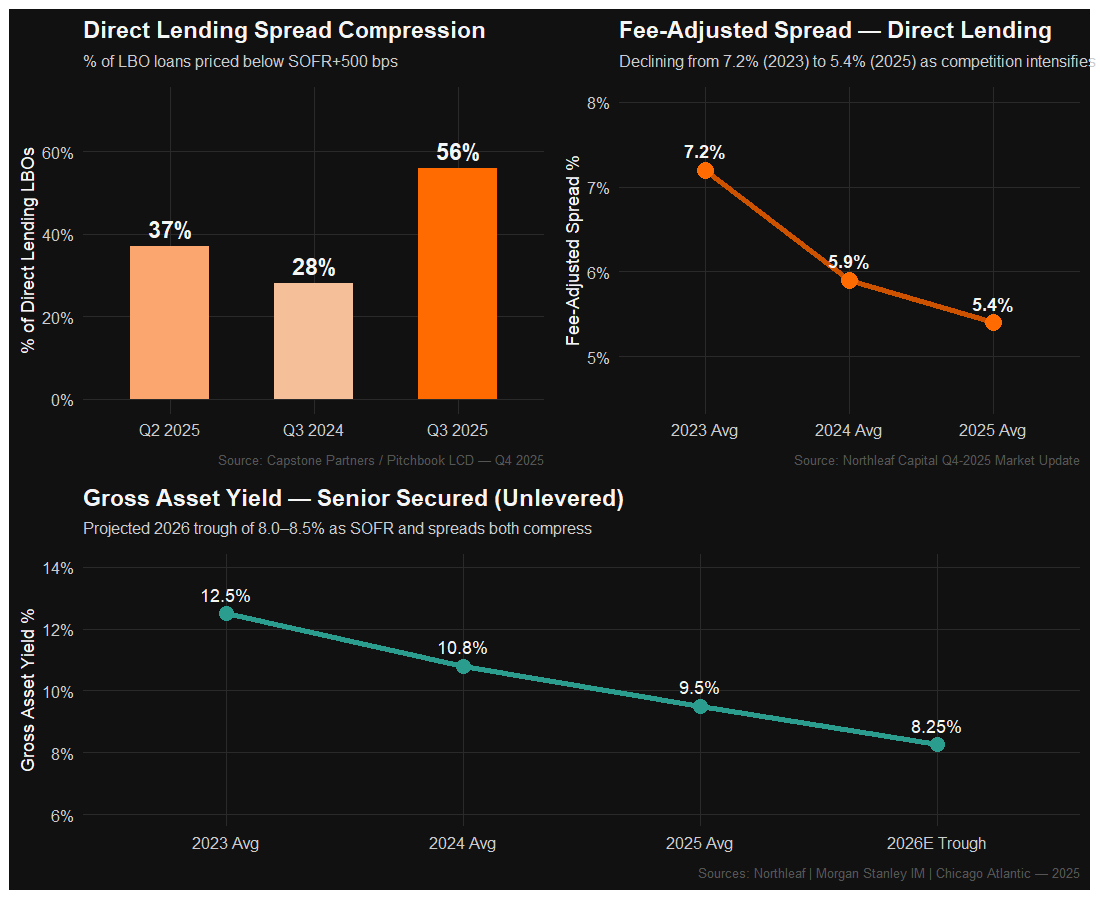
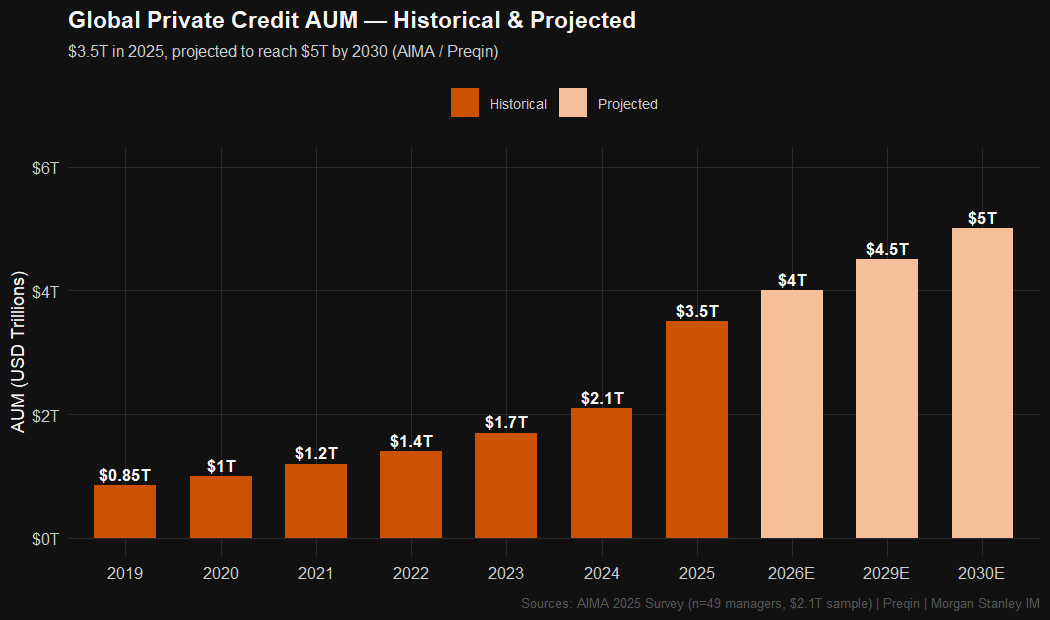
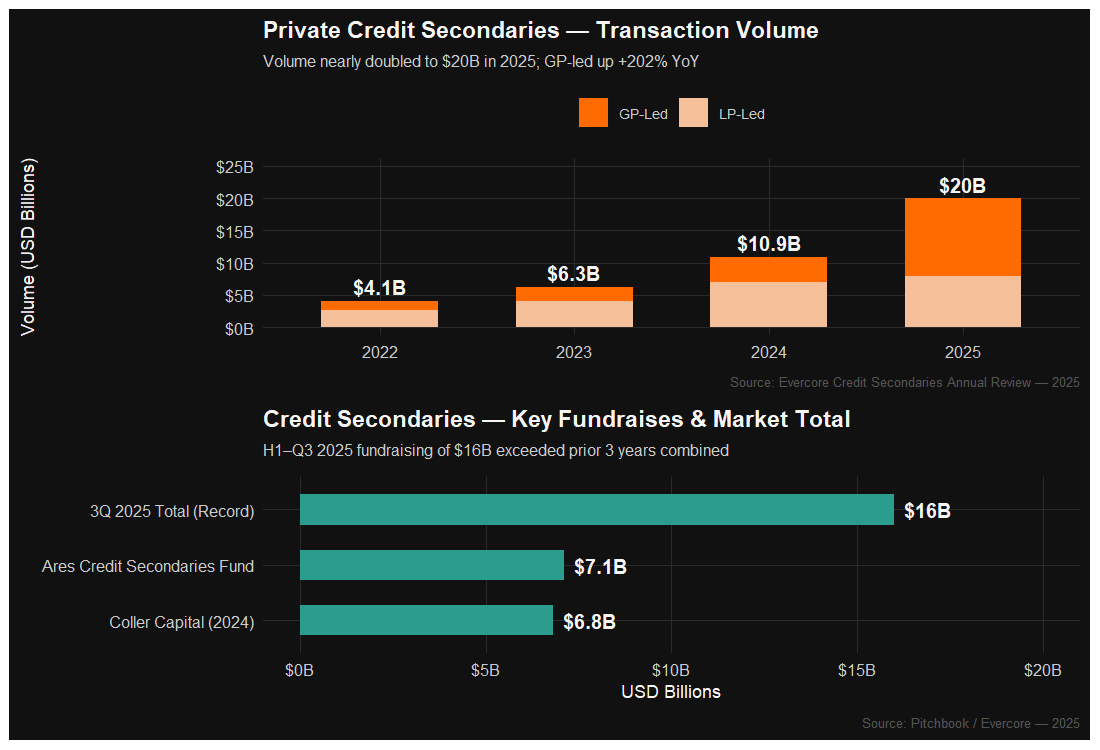
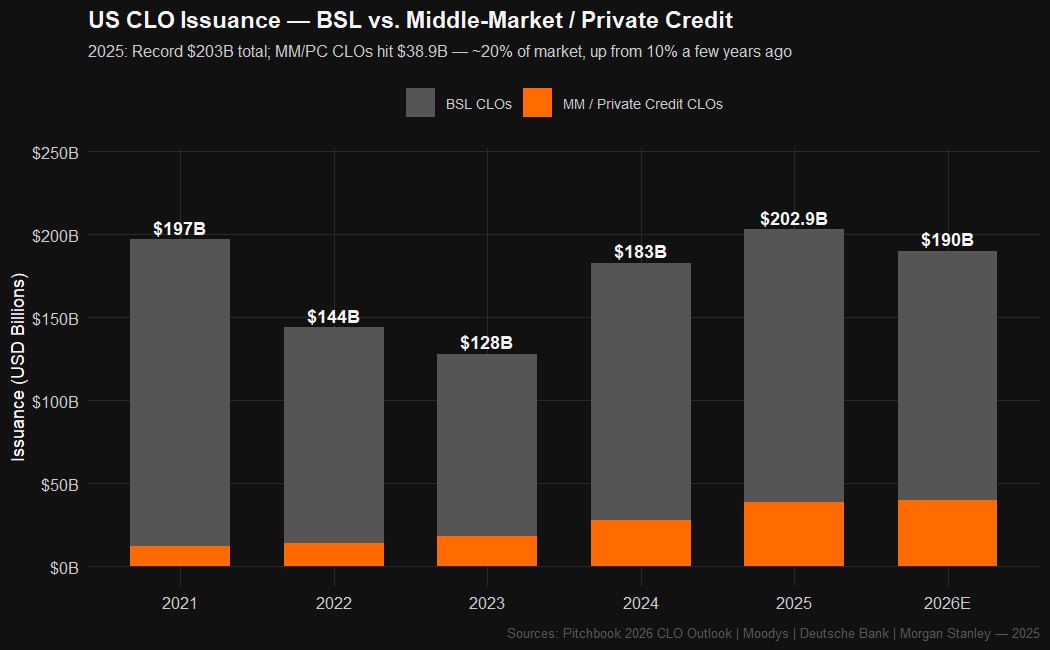
The same private credit market produces default rate readings of 0.75% (realized losses, CDLI) to 9.2% (Fitch full-year 2025) depending on methodology — a 12x range that reflects deep definitional opacity. Lincoln's shadow default rate (bad PIK) has more than doubled from 2.5% (Q4 2021) to 6.4% (Q4 2025), while direct lending spreads compressed over 160 bps since 2023. Global AUM reached $3.5T in 2025 — double the commonly cited $1.7T figure — with $592.8B deployed in 2024 alone. Credit secondaries nearly doubled to $20B, and MM CLO issuance hit a record $38.9B.

Default Rate — Multi-Index Comparison

Multi-Index Default Rate Comparison — 0.75% (CDLI realized) to 9.2% (Fitch full-year 2025)

PIK Usage & Shadow Default Rate Trend

Bad PIK shadow default and total PIK usage trend — Lincoln International Q4 2021 to Q4 2025

Spread Compression

Direct lending spread compression — % of LBOs below S+500, fee-adjusted spread, gross asset yield 2023–2026E

Global Private Credit AUM — Historical & Projected

Global private credit AUM growth: $1.0T (2020) to $3.5T (2025) to $5T (2030E)

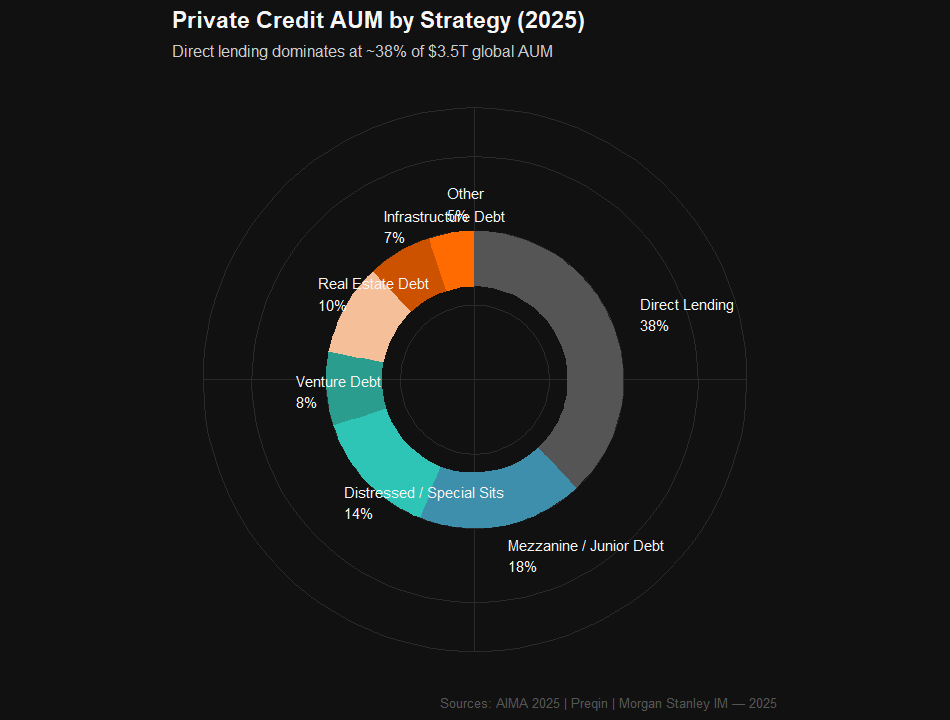
AUM by Strategy (2025)

Private credit AUM by strategy donut chart — direct lending 38%, mezzanine, distressed, venture debt, real estate, infrastructure

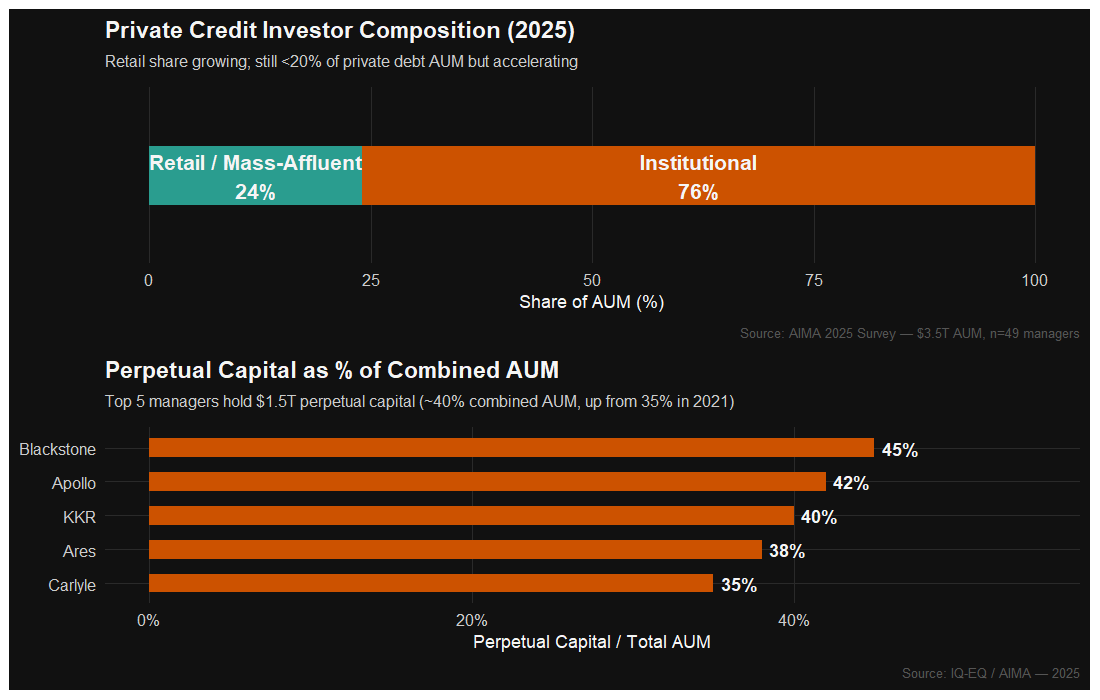
Investor Base Composition

Investor base: 76% institutional vs 24% retail; perpetual capital % by top-5 manager

Credit Secondaries Market — Record Volume

Credit secondaries volume: $10.9B (2024) to $20B (2025); GP-led +202% YoY; key fundraises

CLO Formation — BSL vs. Middle-Market

US CLO issuance: record $203B in 2025; MM/PC CLOs at $38.9B (~20% of market)

Summary Dashboard

Vol. 4 Summary Dashboard — Dry Powder, CDLI Performance, Key Metrics Table