Vol. 1 — Market Overview Vol. 2 — Firm Deep-Dives Vol. 2 Supp — PIK & Roll-Ups Vol. 2.5 — Roll-Up Audit Vol. 3 — Credit Ratings Vol. 4 — Market Structure Vol. 5 — Liquidity & Redemption
Vol. 5 — March 2026

Liquidity & Redemption Architecture

A structural dissection of how private credit funds are built to fail in a redemption shock: non-traded BDC and interval fund AUM doubling to $248B since 2022, 5% quarterly gate caps overwhelmed by 11–12% redemption requests at Apollo and Ares, a 5–7 year asset duration mismatch against 90-day windows, BDC P/NAV multiples collapsing to 0.54–0.82x, and secondary market bids sliding toward 68 cents — the anatomy of a liquidity crisis in real time.

Vol. 5 — Key Metrics Dashboard

Liquidity & Redemption — Current State (March 2026)

$293B Semi-Liquid Vehicle AUM (2025)
11.2% Apollo ADS Redemption Request vs. 5% Cap
11.6% Ares SIF Redemption Request vs. 5% Cap
0.54× Lowest BDC P/NAV (FSK, Q1 2026)
68¢ Secondary Bid Floor — Mar 2026 (Est.)
5.5 yr Duration–Redemption Mismatch
VehicleAUM (2025)Note
Non-Traded BDCs (US)$130BDistributed via wealth management platforms (Merrill, Morgan Stanley, UBS)
Interval Credit Funds (US)$118BQuarterly redemptions capped at 5% of NAV per period
ELTIFs (Europe)$45BSemi-annual redemption; AIFMD-governed; growing retail access post-2023 reform
Total Semi-Liquid AUM$293B11× growth from ~$25B in 2018; retail-driven surge
Growth Since 2022 (3-yr)~2×Accelerated by high-yield environment and wealth channel expansion
Standard Quarterly Gate Cap5% of NAVDesigned for normal outflows (~2–3%); insufficient in stress
EventScaleStatus
Apollo Debt Solutions — Redemption Gate (Mar 2026)11.2% of NAV requested5% cap triggered; ~6.2% queued into backlog
Ares Strategic Income Fund — Redemption Gate (Mar 2026)11.6% of NAV requested5% cap triggered; excess deferred to Q2 2026
Blackstone BCRED — Capital Injection$400M injected by BXSponsor support to stabilise NAV and prevent gate trigger
BREIT Precedent (Nov 2022 – 2023)$8B redemption backlogGates ran 4 consecutive quarters; resolved via $4B BX injection
COVID Interval Fund Gates (Mar 2020)~$45B AUM affectedMultiple funds triggered caps within 2 weeks of market dislocation
MetricCurrent (Mar 2026)Normal Range
BDC P/NAV — FSK (lowest)0.54×0.85–0.95× historical avg
BDC P/NAV — BXSL0.74×1.05–1.12× at peak (2022)
BDC P/NAV — ORCC0.68×0.98–1.04× in 2023–24
BDC P/NAV — ARCC (most resilient)0.82×0.96–1.08× historical avg
Credit Secondary Bid (direct lending)68–78¢ on dollar90–96¢ in normal markets
Credit Secondary Bid (COVID trough)68–78¢ on dollarSimilar floor; recovered to 80–84¢ within 2 quarters
Credit Secondaries Market Volume (2025)$20B$10.9B in 2024; GP-led +202% YoY

Sources: SEC filings · AIMA 2025 · Preqin · Apollo/Ares/BX fund disclosures · Evercore Secondaries · Jefferies · Setter Capital · PCI research

Vol. 5 — Liquidity & Redemption Architecture

The Structural Fault Lines of Private Credit Liquidity

Key Findings

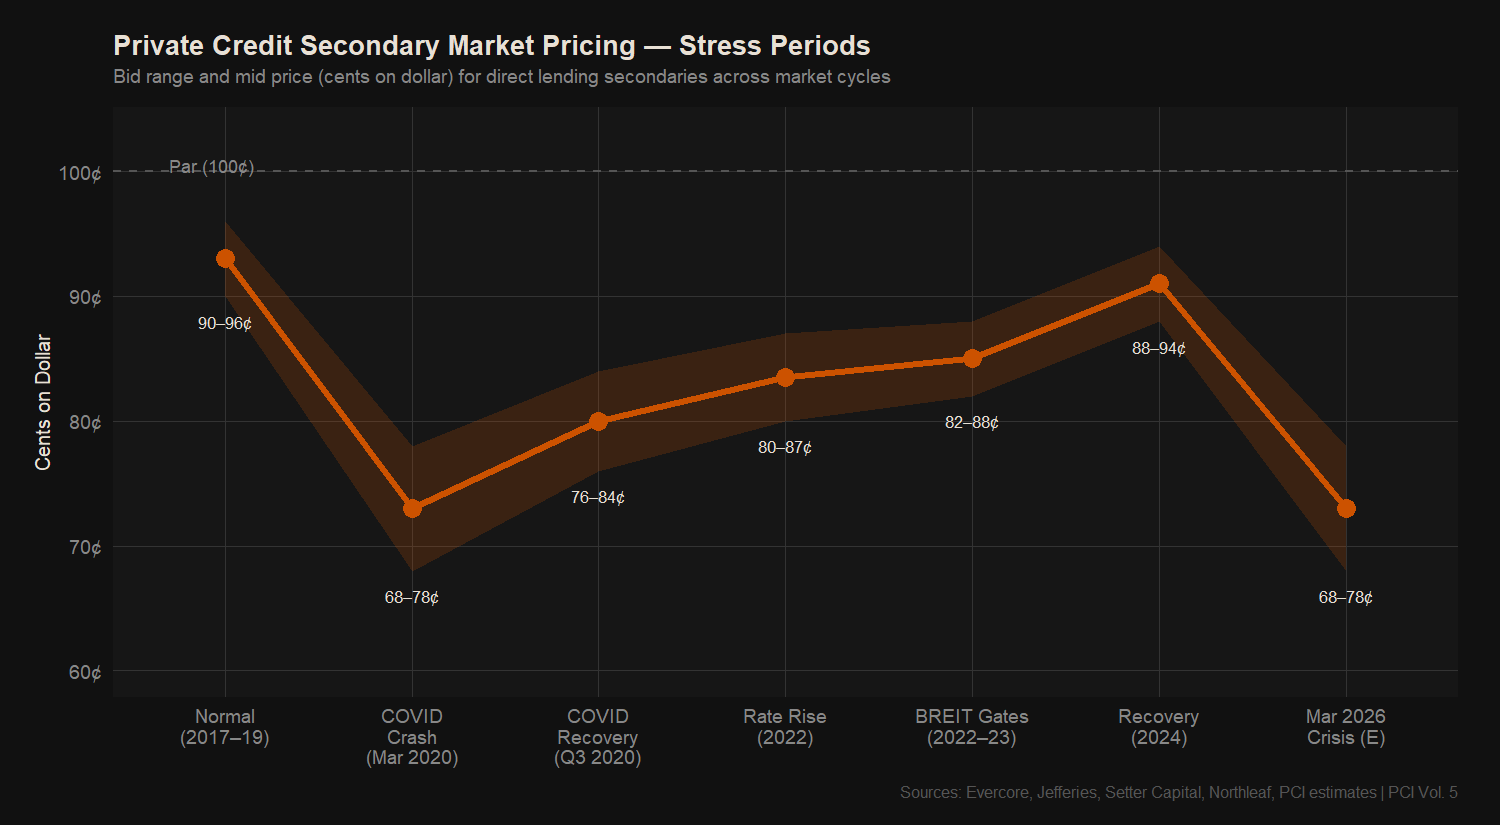
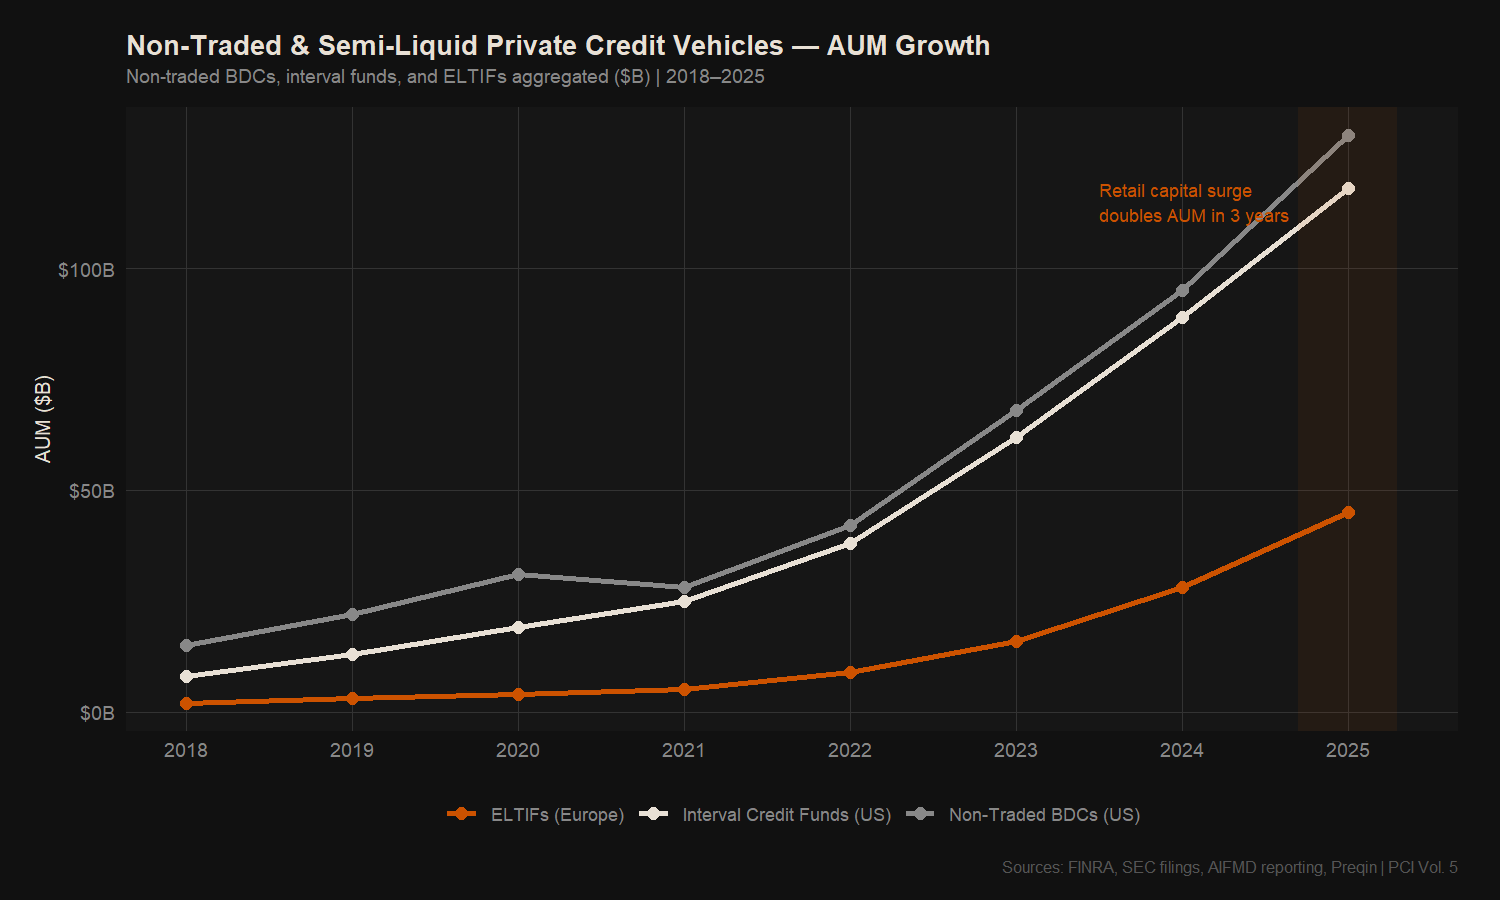
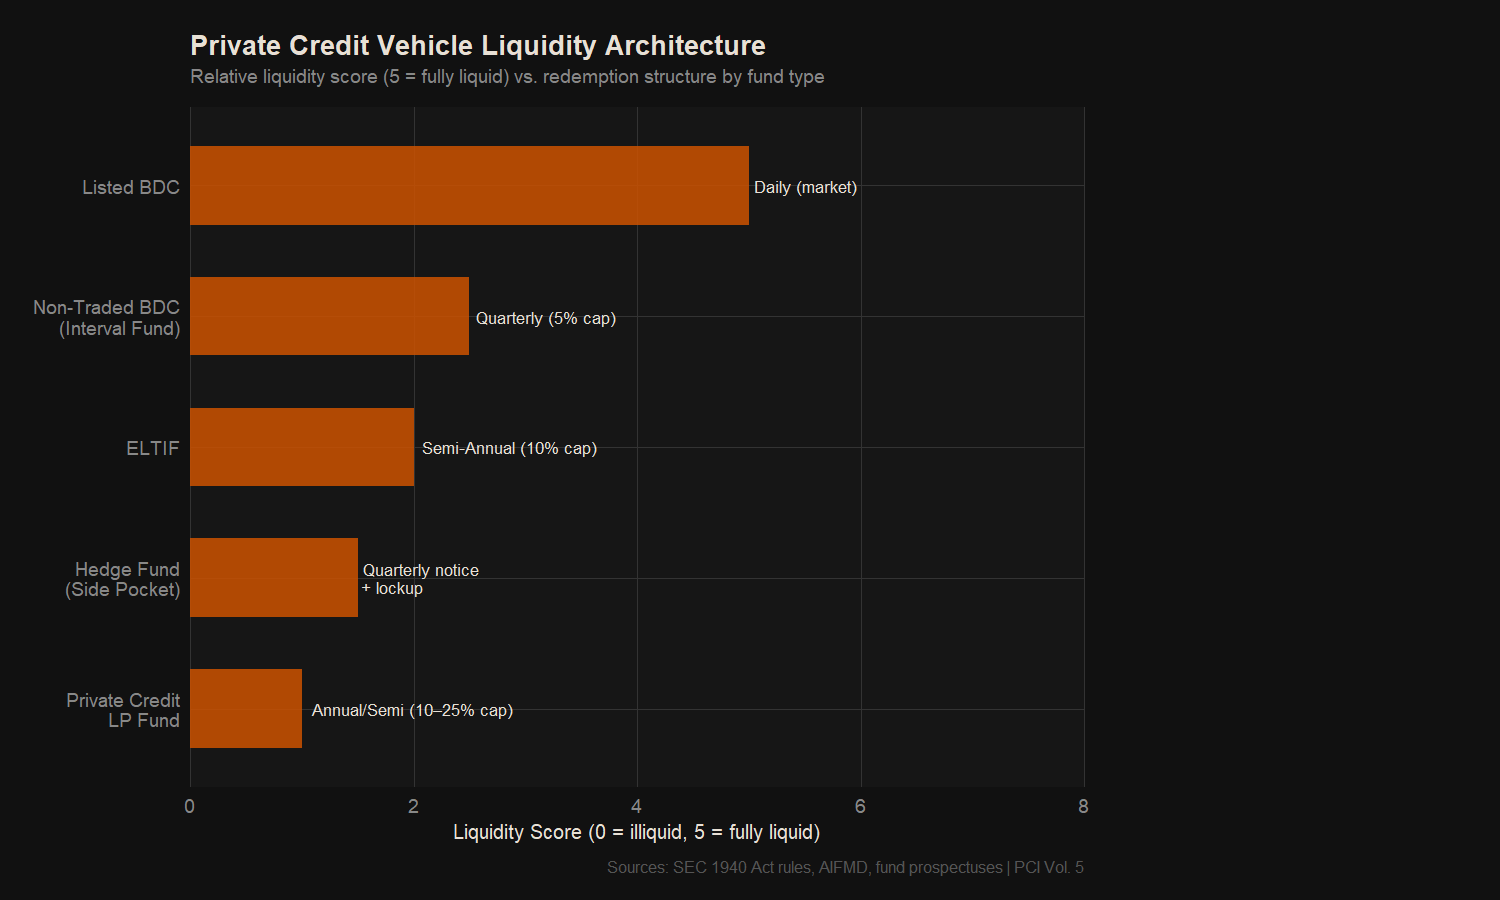
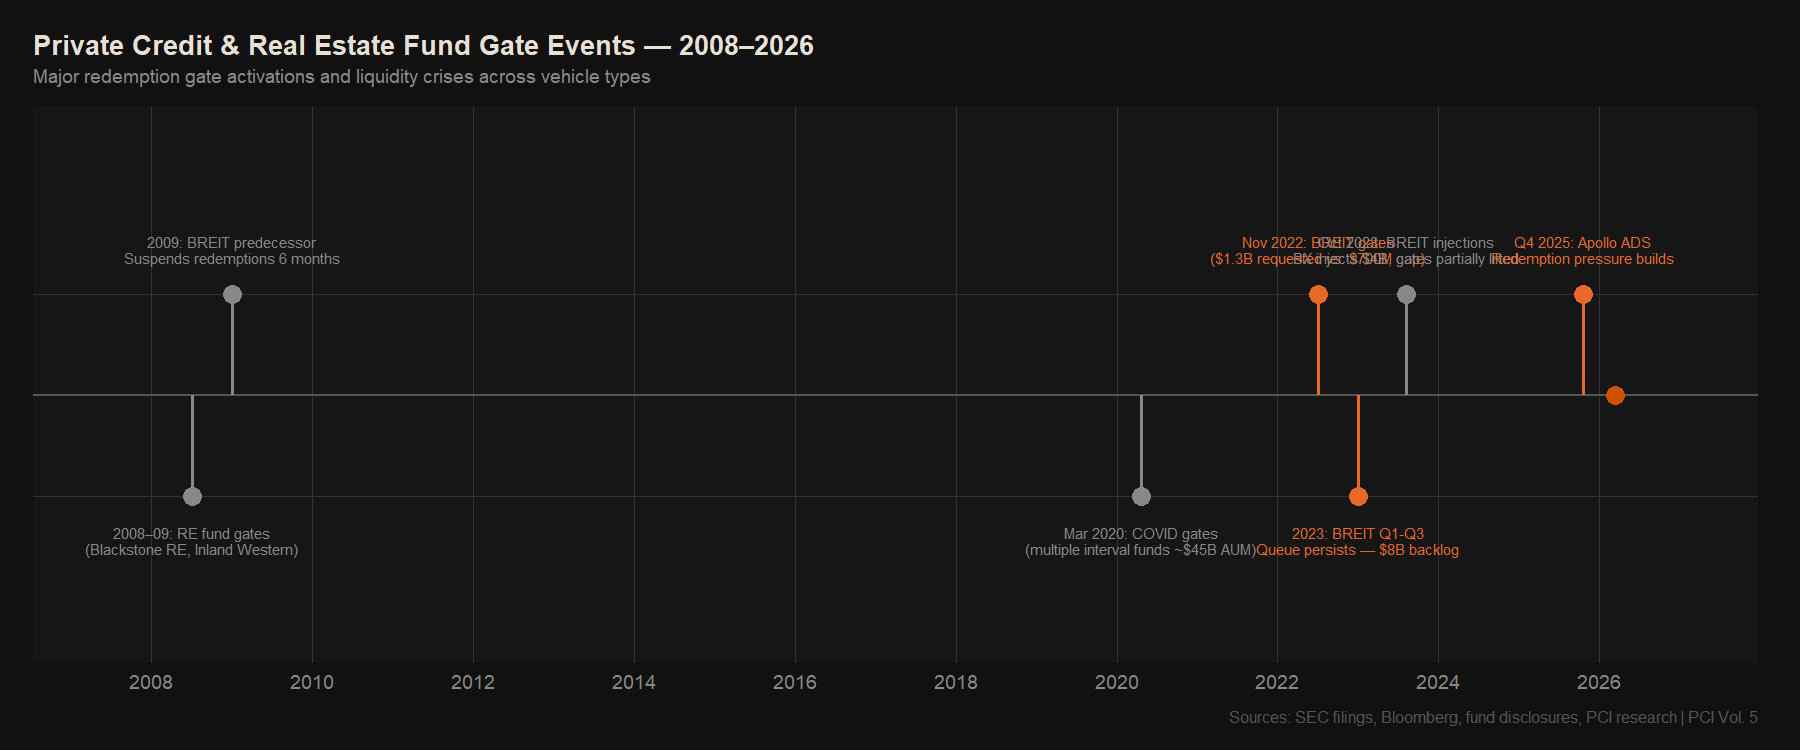
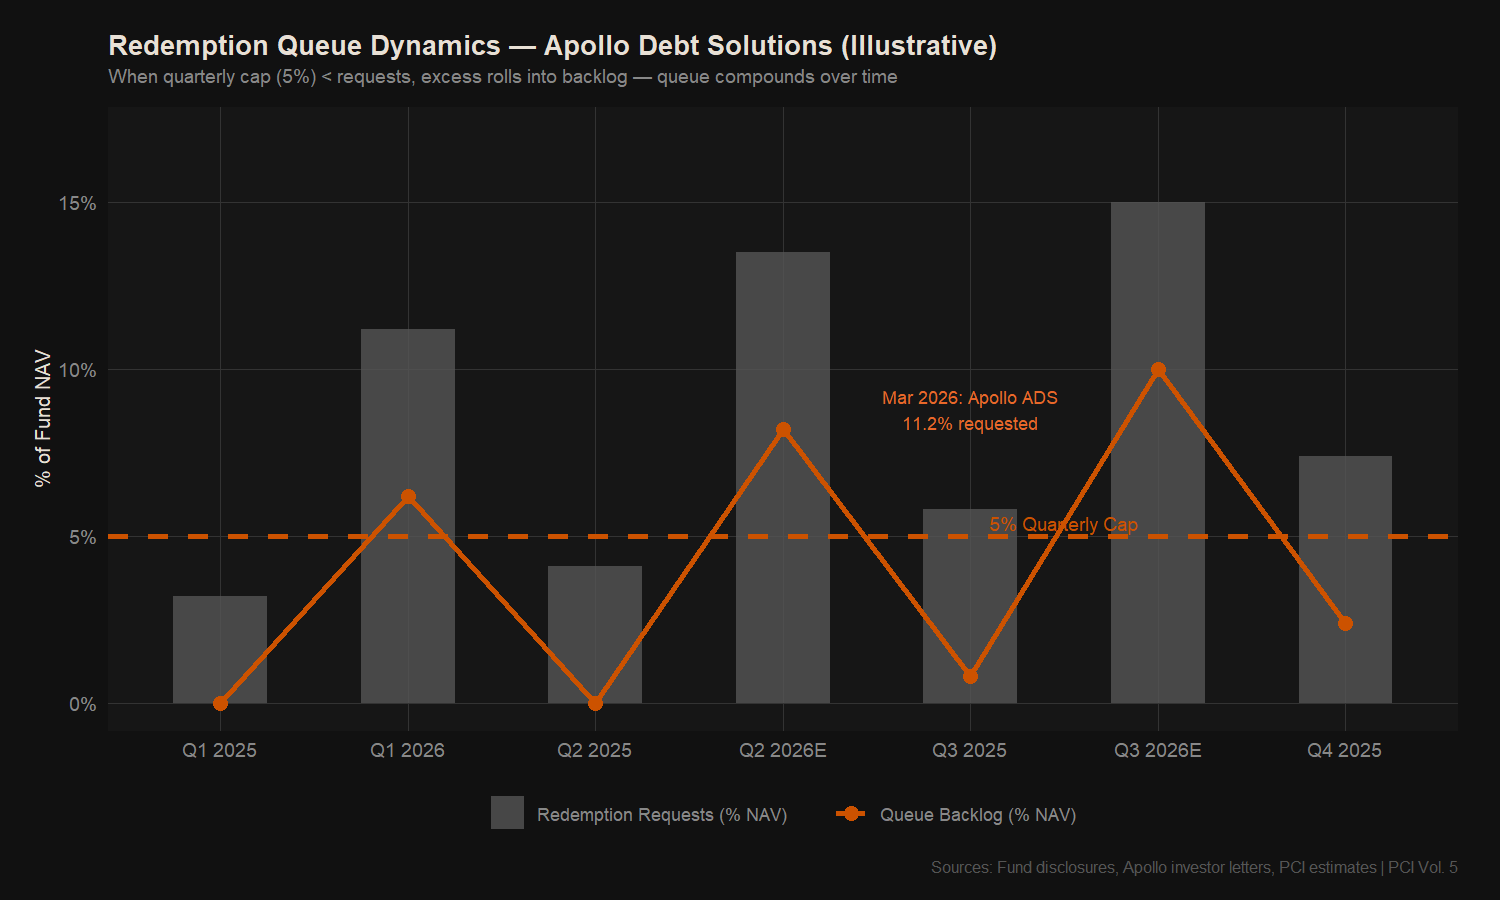
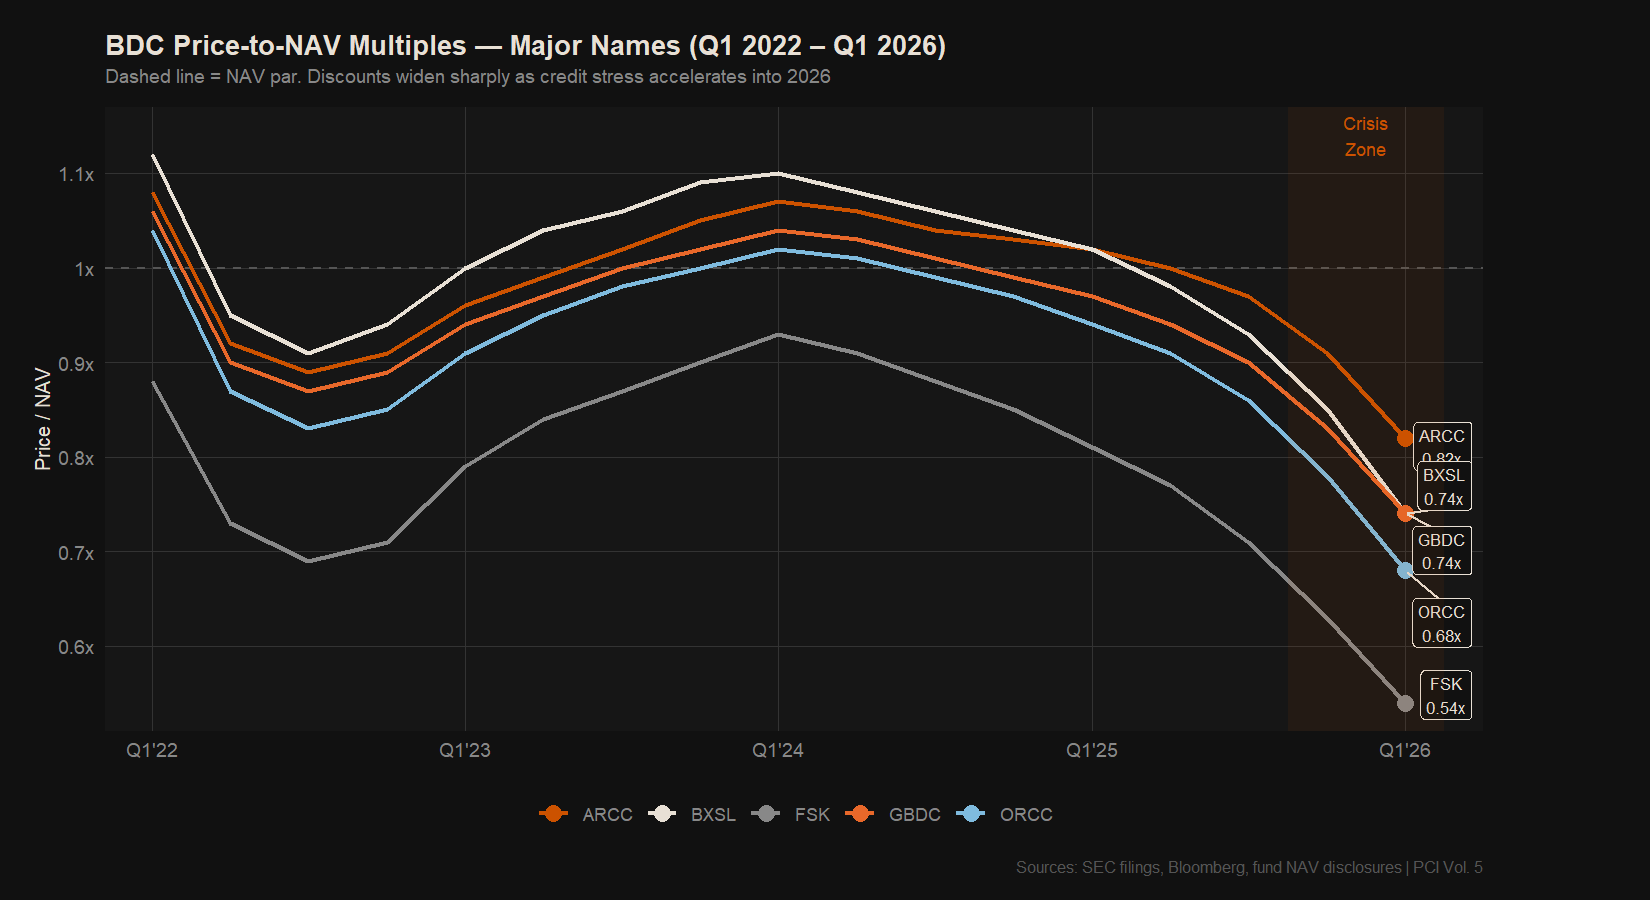
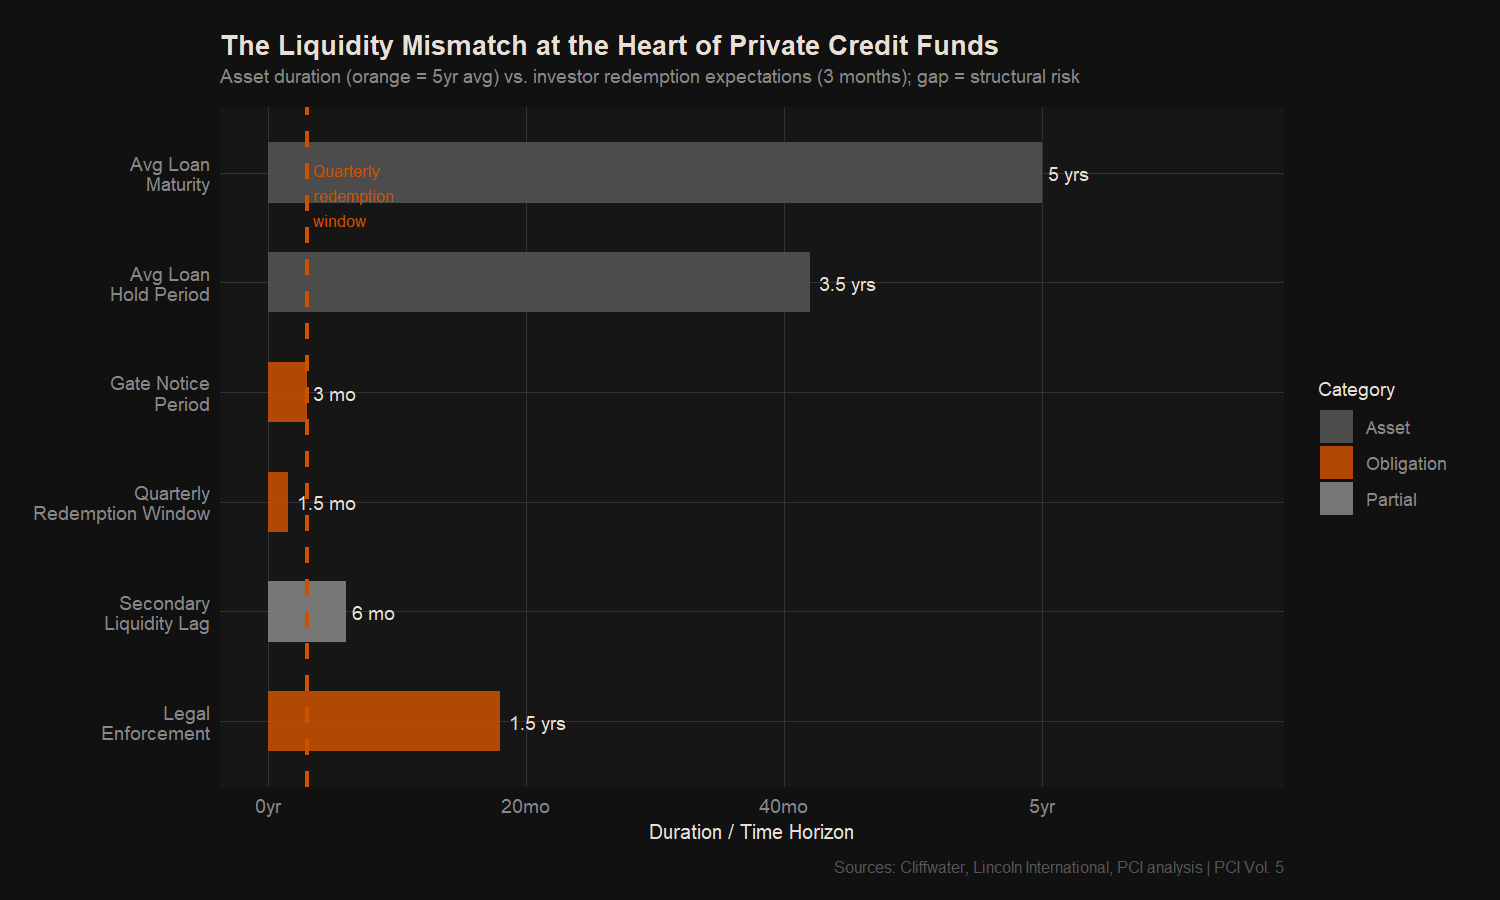
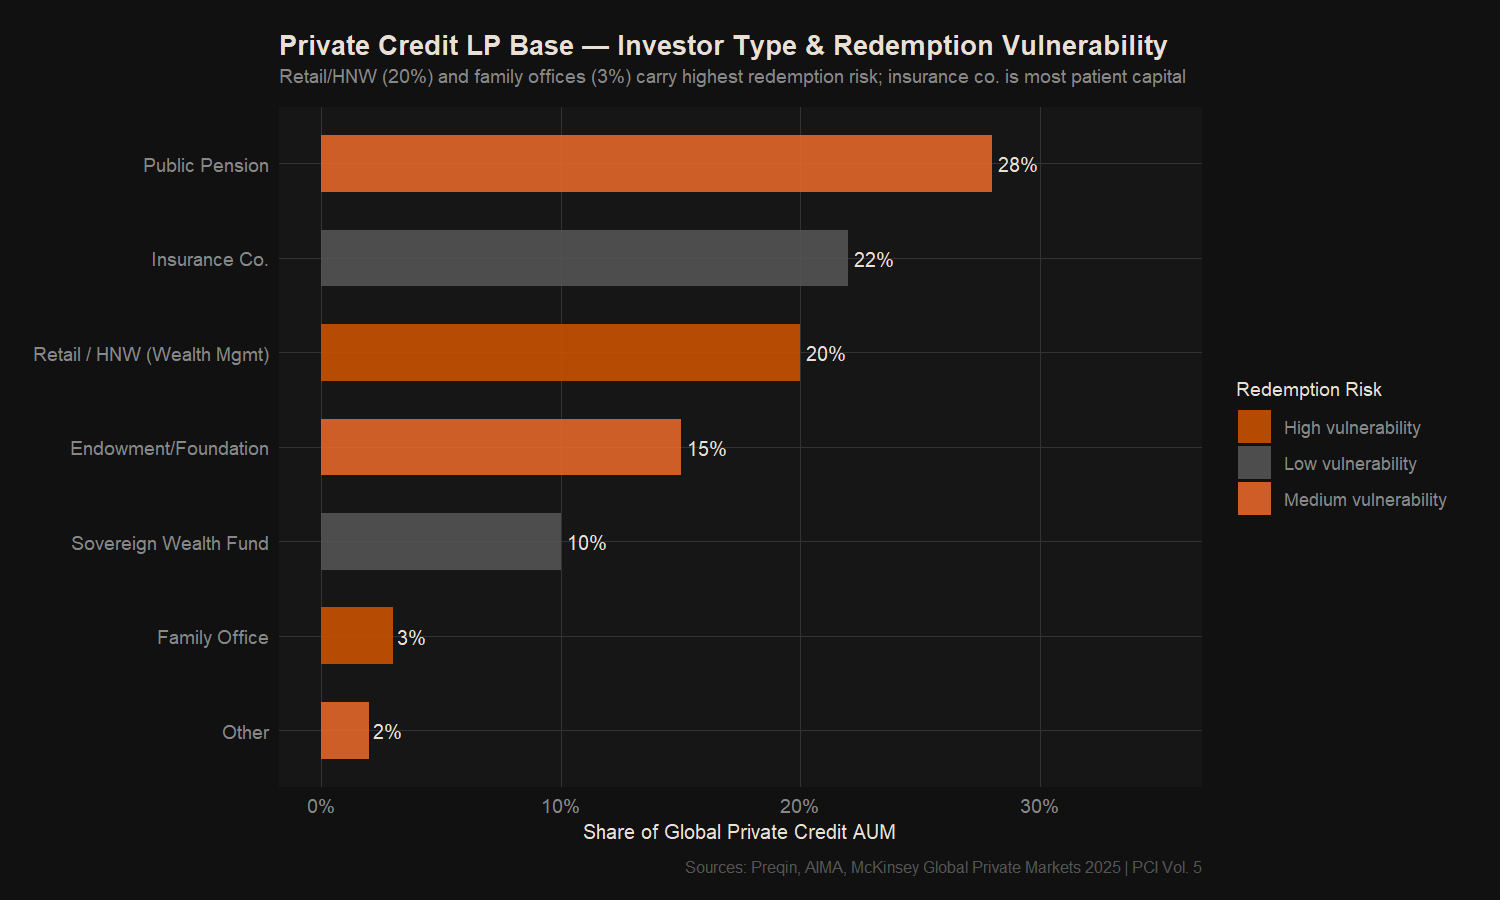
Non-traded BDCs, interval credit funds, and ELTIFs have grown from ~$25B (2018) to over $293B (2025) — an 11x surge driven almost entirely by retail wealth management distribution. These vehicles promise quarterly liquidity through a 5% gate cap, but in stress, redemption requests exceed the cap by 2x or more, creating compounding queues. Apollo ADS (11.2% requested) and Ares SIF (11.6% requested) triggered March 2026's triple gate event alongside Blackstone BCRED's $400M capital injection. The structural mismatch is simple: assets have a 5–7 year duration, windows are 90 days, and the 5% cap was designed for normal outflows — not a crisis. BDC P/NAV multiples have compressed to 0.54–0.82x; credit secondaries are pricing at 68–78 cents on the dollar.

Non-Traded & Semi-Liquid Private Credit Vehicles — AUM Growth (2018–2025)

Non-traded BDC, interval credit fund, and ELTIF AUM growth 2018–2025 — $293B total by 2025

Private Credit Vehicle Liquidity Architecture

Liquidity score comparison by fund type — listed BDC vs. interval fund vs. LP fund vs. ELTIF vs. hedge fund side pocket

Historical Gate Event Timeline (2008–2026)

Timeline of major private credit and real estate fund gate events from 2008 to March 2026 triple gate

Redemption Queue Dynamics — Apollo Debt Solutions (Illustrative)

Redemption requests vs. 5% quarterly cap — queue backlog builds from Q3 2025 to 10% of NAV by Q3 2026E
P/NAV multiples for ARCC, BXSL, ORCC, FSK, GBDC — discounts widening sharply into Q1 2026 crisis

The Liquidity Mismatch at the Heart of Private Credit Funds

Asset duration (5yr avg loan maturity) vs. 90-day redemption window — structural gap visualized

Investor Base & Redemption Vulnerability

LP base composition by investor type with redemption vulnerability rating — retail/HNW and family offices highest risk

Secondary Market Pricing During Stress Periods

Credit secondaries bid range across market cycles — 90-96 cents normal, sliding to 68-78 cents in March 2026 crisis