Vol. 3 — Credit Ratings Deep-Dive
Agency Ratings, Shadow NAV & Secondary Market Stress
Key Findings
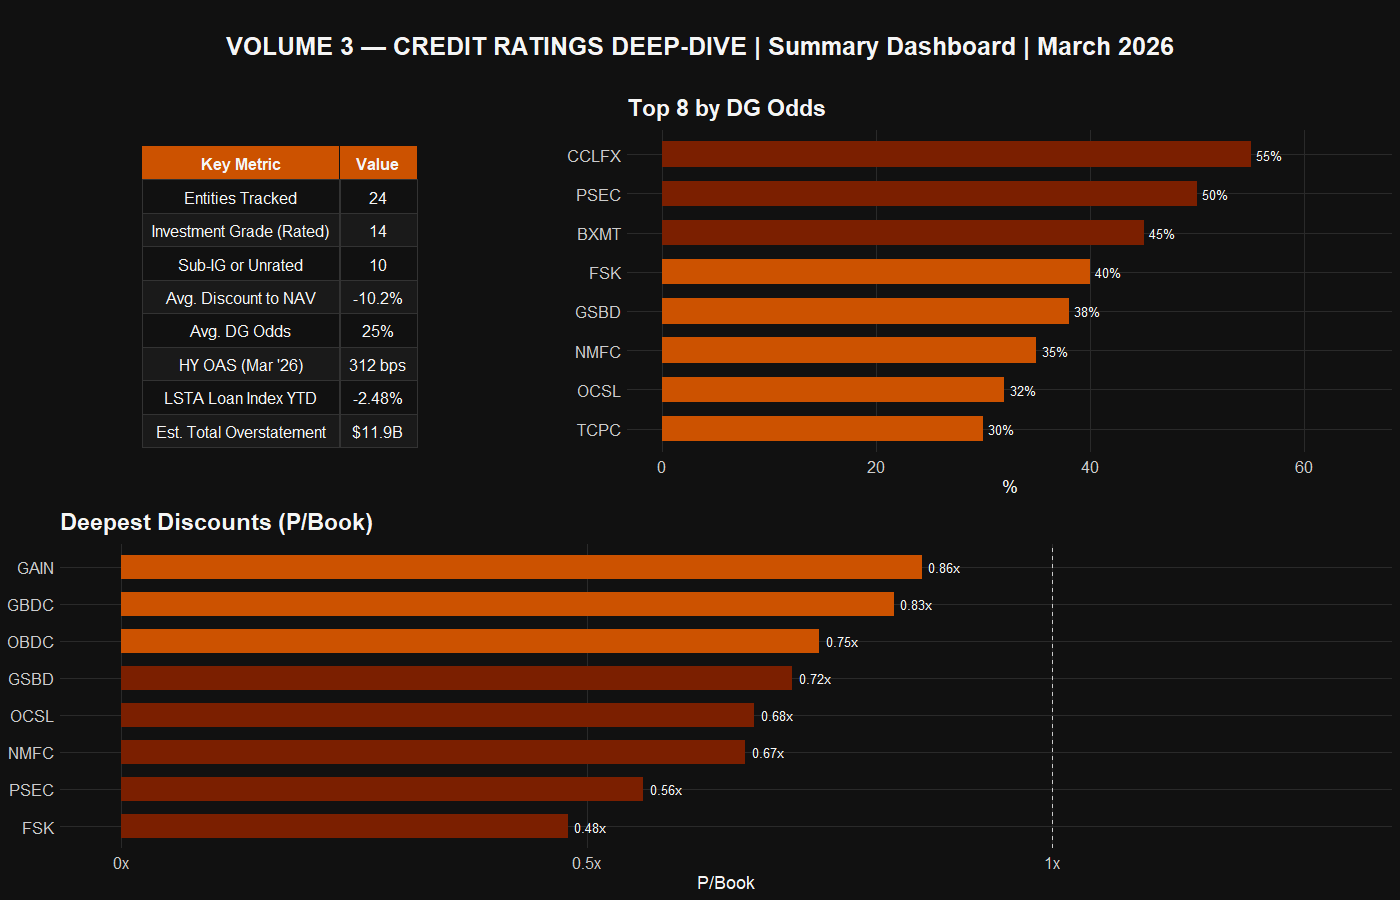
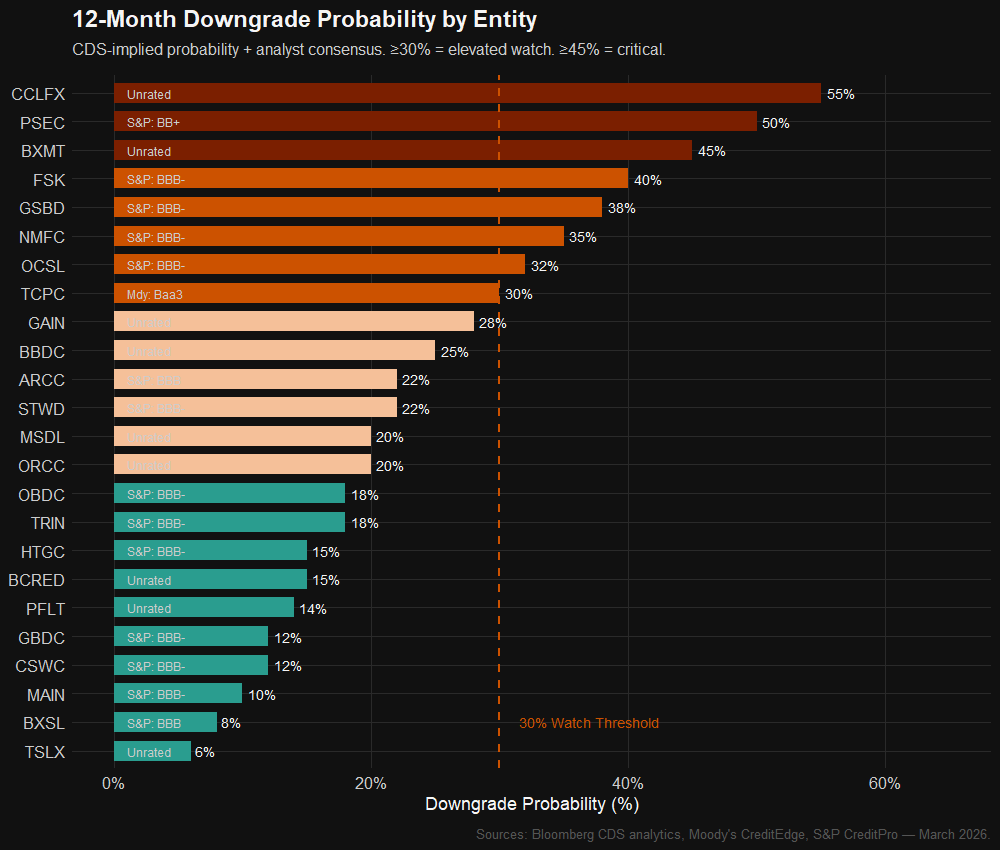
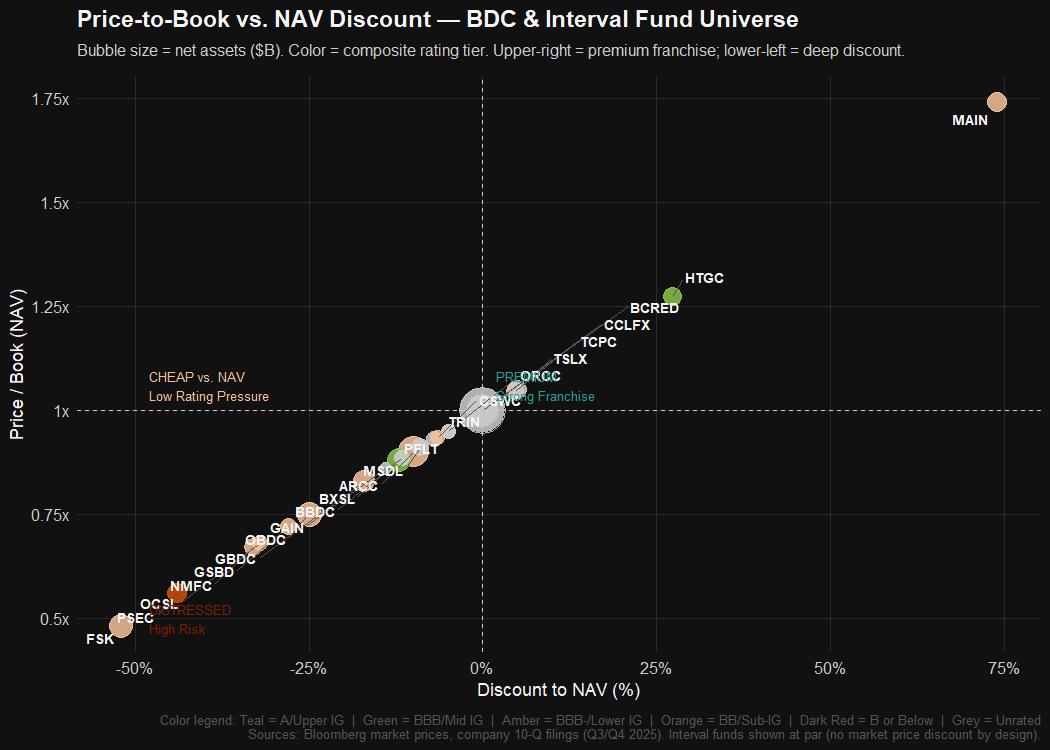
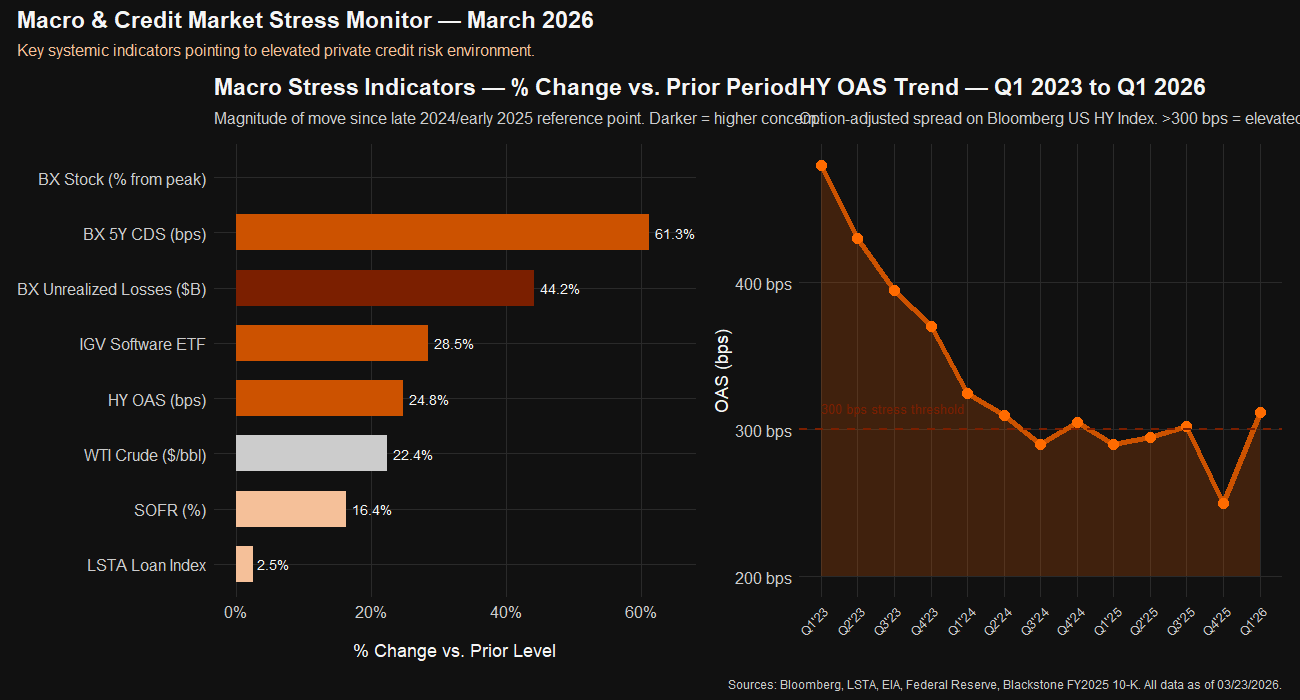
CCLFX (55%) and PSEC (50%) carry the highest 12-month downgrade probability. FSK trades at 0.48x P/Book — the deepest discount in the universe. Shadow NAV analysis suggests $6.2B total overstatement across 12 vehicles, with BCRED's reported $24.79 NAV estimated at $22.50 fair value (-9.2%). Blackstone's 5Y CDS has doubled to 100 bps; unrealized losses now $125.6B vs. $87.1B at FY2024.
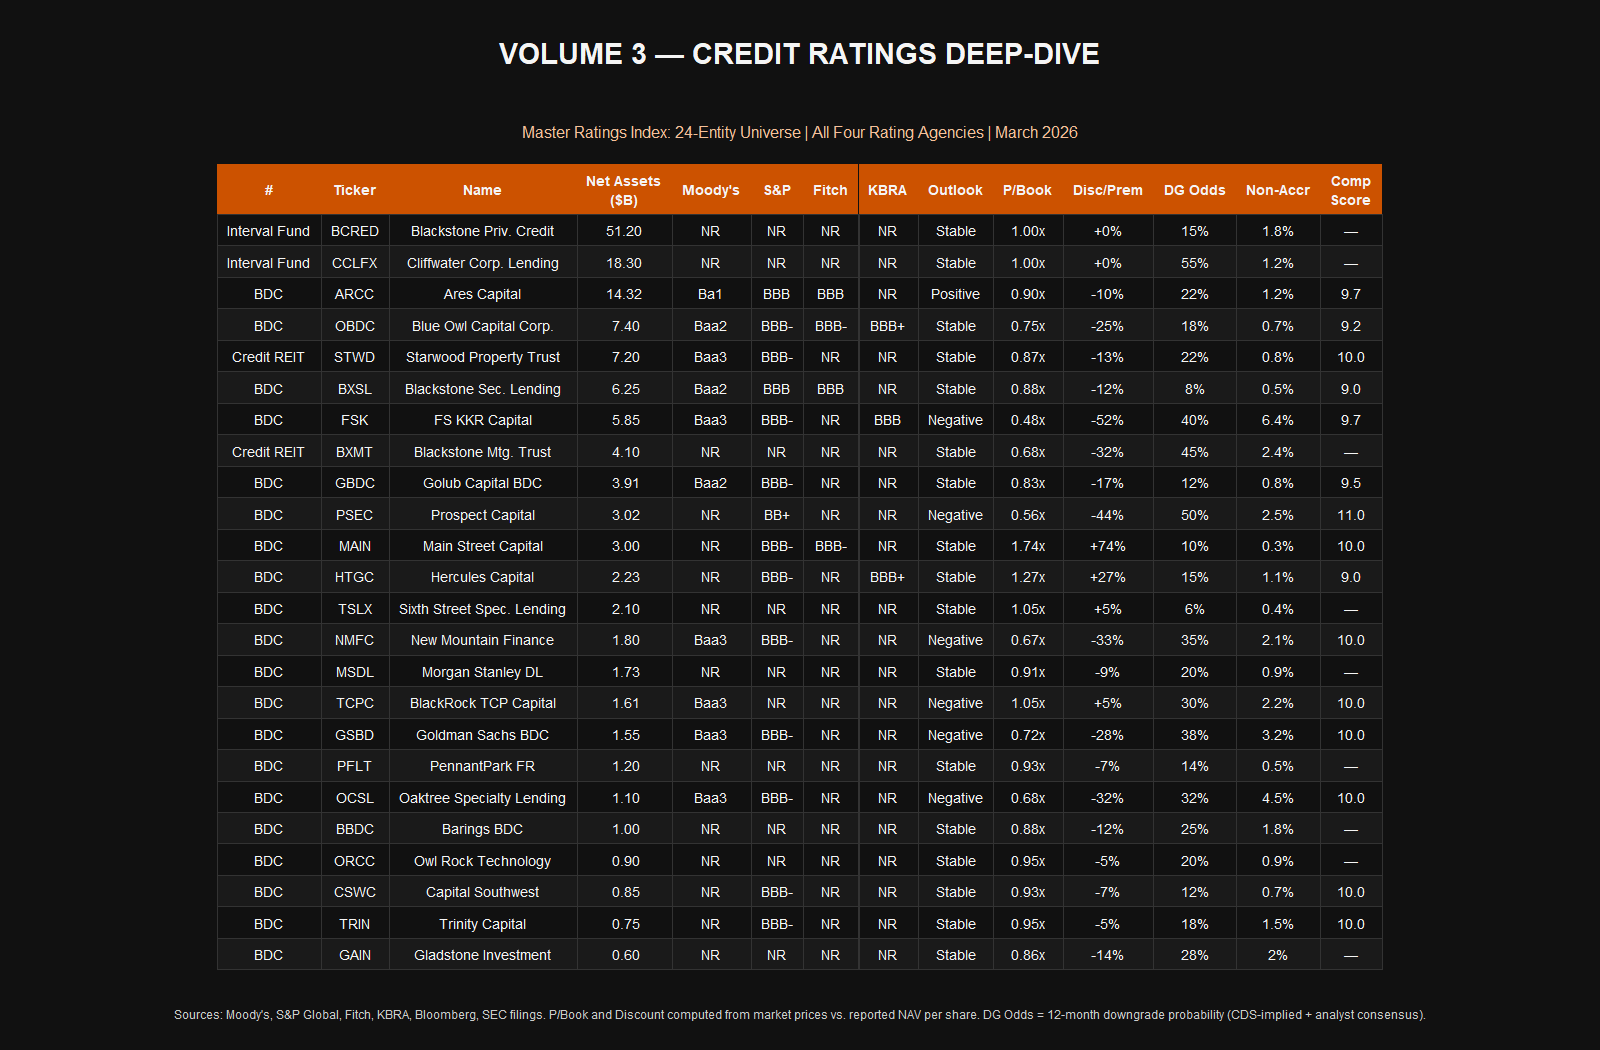
Master Ratings Index — 24-Entity Universe
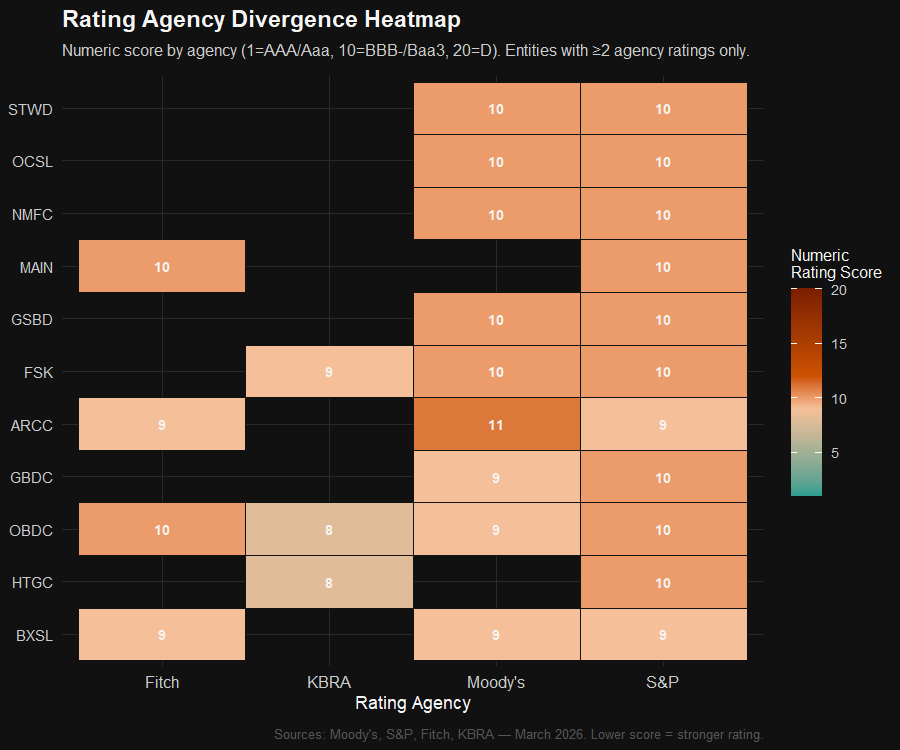
Rating Agency Divergence
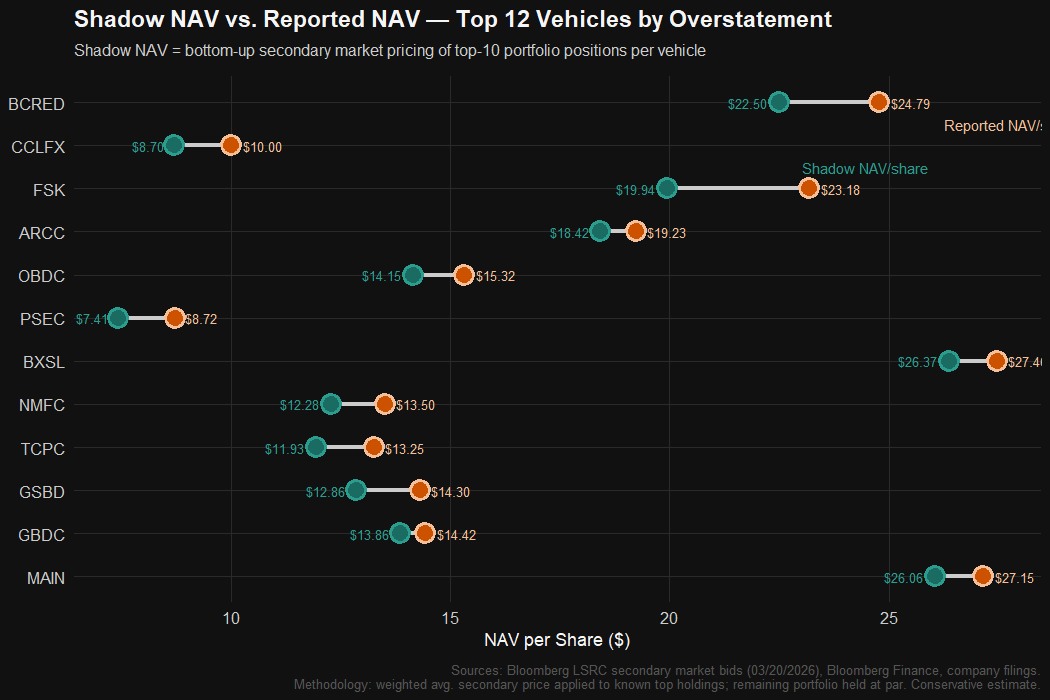
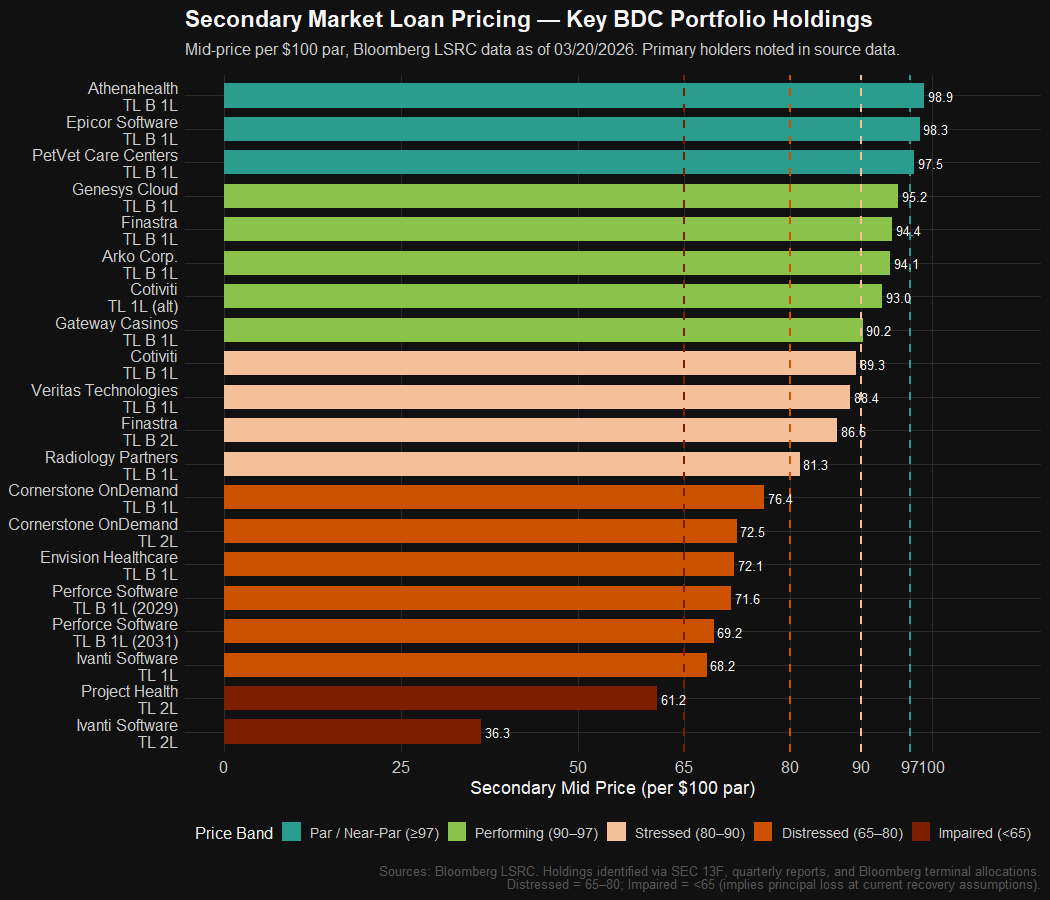
Secondary Market Loan Pricing
12-Month Downgrade Probability
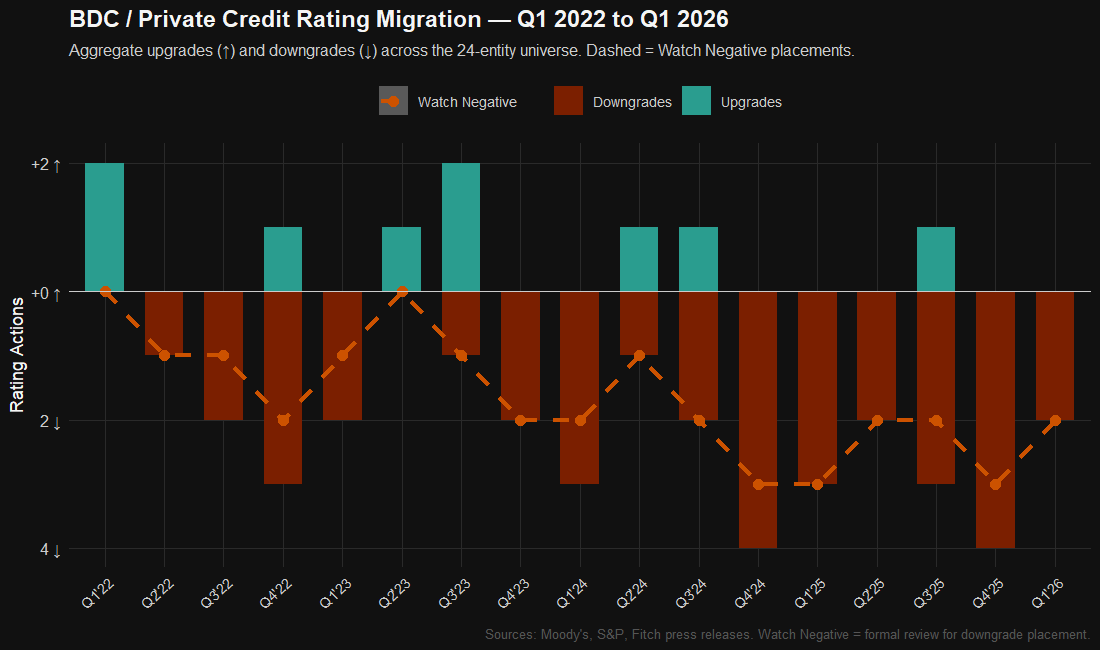
Rating Migration History
P/Book vs. NAV Discount
Macro Stress Dashboard
Summary Dashboard